. 2007 Sep 15;179(6):4035-44.
doi: 10.4049/jimmunol.179.6.4035.

Reduction of bleomycin-induced pulmonary fibrosis by serum amyloid P

Affiliations

Reduction of bleomycin-induced pulmonary fibrosis by serum amyloid P

Darrell Pilling et al. J Immunol. .

Abstract

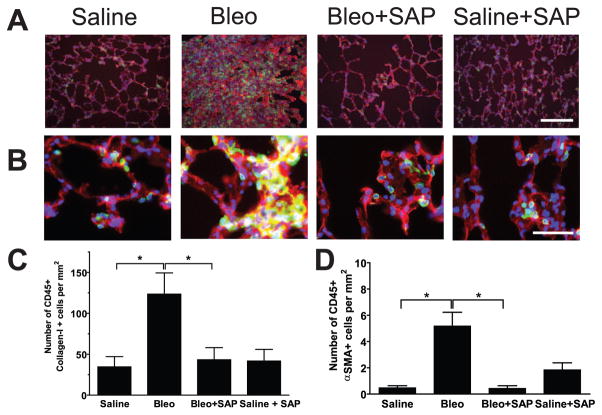
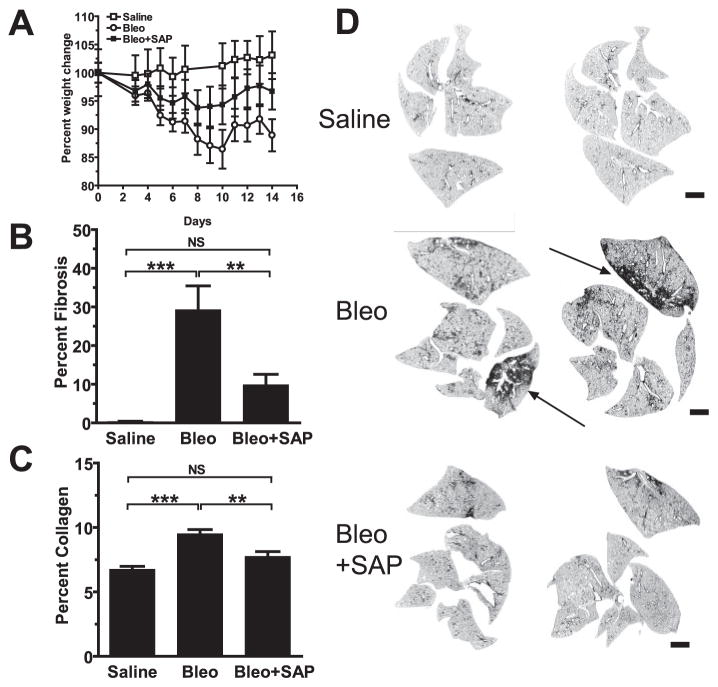
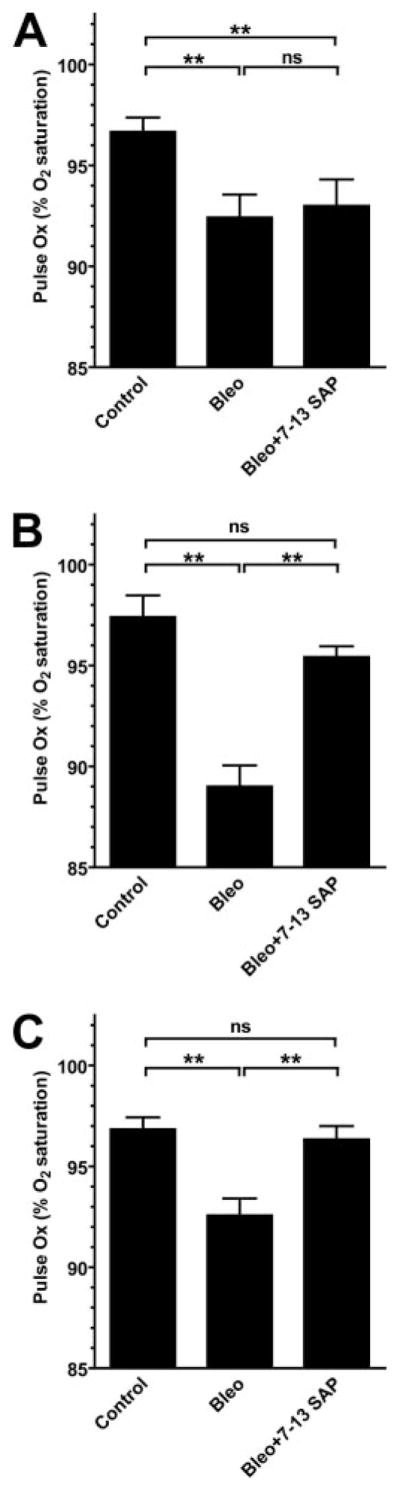
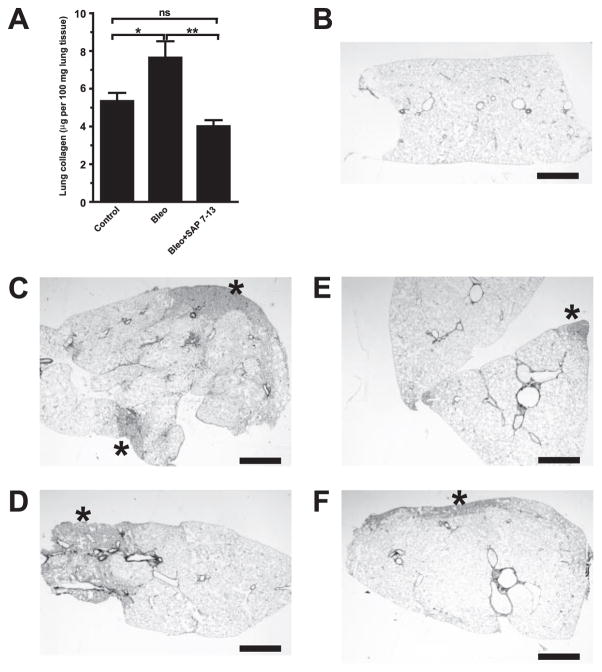
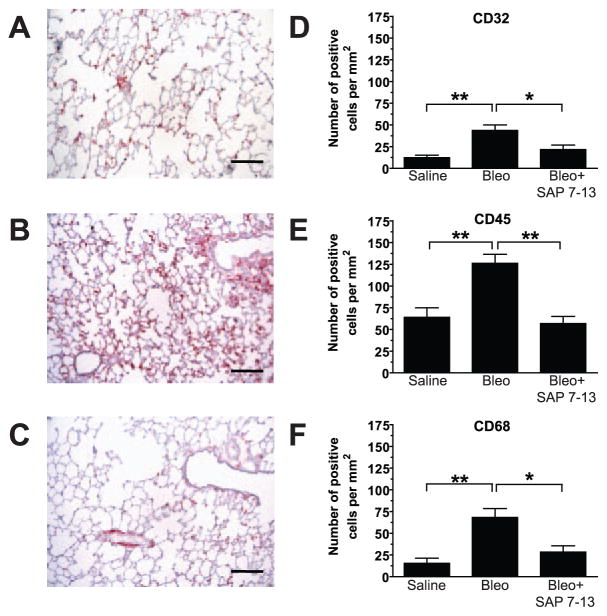
Fibrotic diseases such as scleroderma, severe chronic asthma, pulmonary fibrosis, and cardiac fibrosis kill tens of thousands of people each year in the U.S. alone. Growing evidence suggests that in fibrotic lesions, a subset of blood monocytes enters the tissue and differentiates into fibroblast-like cells called fibrocytes, causing tissue dysfunction. We previously found that a plasma protein called serum amyloid P (SAP) inhibits fibrocyte differentiation in vitro. Bleomycin treatment is a standard model for pulmonary fibrosis, and causes an increase in collagen, fibrocytes, and leukocytes in the lungs, and a decrease in peripheral blood hemoglobin oxygen saturation. We find that injections of rat SAP in rats reduce all of the above bleomycin-induced changes, suggesting that the SAP injections reduced the bleomycin-induced pulmonary fibrosis. We repeated these studies in mice, and find that injections of murine SAP decrease bleomycin-induced pulmonary fibrosis. To confirm the efficacy of SAP treatment, we used a delayed treatment protocol using SAP from day 7 to 13 only, and then measured fibrosis at day 21. Delayed SAP injections also reduce the bleomycin-induced decrease in peripheral blood hemoglobin oxygen saturation, and an increase in lung collagen, leukocyte infiltration, and fibrosis. Our data suggest the possibility that SAP may be useful as a therapy for pulmonary fibrosis in humans.


Figures

FIGURE 1
FIGURE 1
Preparation of rat and murine SAP. A, Purified rat SAP was analyzed by PAGE, on a 4–15% reducing gel, and stained with Coomassie. M, BenchMark m.w. markers. Lanes 1–5, 1000, 300, 100, 30, and 10 μg/ml BSA-loading controls. Lanes 6–10, 1000, 300, 100, 30, and 10 μg/ml human SAP-loading controls. Lanes 11 and 12, 1/1000 and 1/300 dilutions of purified rat SAP. B, A Western blot of purified rat SAP was stained with goat anti-rat SAP Abs. M, MagicMark m.w. markers. Lanes 1–3, 10, 1, and 0.1 μg/ml human SAP. Lanes 4–6, 100, 10, and 1 μg/ml rat CRP. Lanes 7–9, 1000-, 300-, and 100-fold dilutions of purified rat SAP. C, Purified mouse SAP was analyzed by PAGE on a 4–15% reducing gel, and stained with Coomassie. M, BenchMark m.w. markers. Lanes 1–3, 5-, 20-, and 10-fold dilutions of purified mouse SAP. Lanes 4–8, 150, 100, 75, 50, and 25 μg/ml BSA-loading controls. D, A Western blot of purified mouse SAP was stained with sheep anti-mouse SAP Abs. M, MagicMark m.w. markers. Lanes 1–3, 1% human, mouse, and rat serum. Lanes 4 and 5, 1 μg of commercial human SAP and CRP, respectively. Lanes 6–8, 1, 0.3, and 0.1 μg/ml commercial mouse SAP-loading controls. Lanes 9–11, 1, 0.3, and 0.1 μg/ml commercial rat CRP-loading controls. Lane 12, 1 μg/ml purified mouse SAP.
FIGURE 2
FIGURE 2
SAP injections reduce bleomycin-induced histological changes in rat lungs. A, Cryosections from day 14 rat lungs were stained with H&E to show cellular inflammation, or picrosirius red to show total collagen deposition. Sections were also stained with anti-collagen-I or anti-α-SMA Abs. Bars are 200 μm. Bottom row, Sections were also dual labeled with anti-α-SMA Abs (green) and the nuclear counterstain DAPI (blue), at higher magnification to show α-SMA expression in individual cells. Bar in bottom row is 50 μm. Photomicrographs are representative sections of three to eight animals per group. Saline, intratracheal instillation of saline and then injections of phosphate buffer; Bleo, intratracheal instillation of bleomycin and then injections of buffer; Bleo + SAP, intratracheal instillation of bleomycin and then SAP injections; Saline + SAP, intratracheal instillation of saline and then SAP injections. B–D, Low magnification images of cryosections from day 14 rat lungs. Sections were stained with picrosirius red to show collagen deposition. B, Intratracheal instillation of saline; C, intratracheal instillation of bleomycin, and arrows point to areas of fibrosis. D, Intratracheal instillation of bleomycin and then SAP injections. Bar is 2 mm.
FIGURE 3
FIGURE 3
SAP injections reduce bleomycin-induced changes in rat lungs. A, Whole right lungs were removed at day 14, and assessed for collagen content. Values are means ± SEM (n = 4–5 per group). Compared with saline, bleomycin instillation led to a significant elevation in collagen levels as determined by Student’s t test. Compared with bleomycin instillation, intratracheal instillation of bleomycin and then SAP injections had a significant reduction in collagen levels as determined by Student’s t test. B and C, Sections were stained with anti-collagen-I (B) or anti-α-SMA Abs (C), and the percentage area stained was quantified as a percentage of the total area of lung. Values are means ± SEM (n = 3–6 rats per group). Significance was determined by ANOVA. D, Rats (n = 6 per group) were assessed for peripheral blood oxygen content (pulse Ox) at day 14, and compared with values from 25 healthy age-matched male rats (baseline). Values are means ± SEM. Significance was determined by ANOVA.
FIGURE 4
FIGURE 4
SAP injections reduce bleomycin-induced leukocyte infiltration in rat lungs. Cryosections of rat lung were labeled with Abs against CD32 (FcγRII-bearing B cells, neutrophils, and macrophages), CD45 (total leukocytes), and CD68 (macrophages). A, Representative photomicrographs of lungs at day 14. Bars are 200 μm. B–D, Quantification of the numbers of cells stained for CD32 (B), CD45 (C), and CD68 (D). Values are means ± SEM (n = 3–6 rats per group). Significance was determined by ANOVA.
FIGURE 5
FIGURE 5
SAP injections reduce the number of bleomycin-induced fibrocytes in rat lungs. A, Representative photomicrographs of lungs at day 14. Cryosections of rat lungs were labeled with Abs to collagen-I (red) and CD45 (green), and were counterstained with DAPI (blue). Bar is 200 μm. B, Regions from A at higher magnification show individual cells dual labeled (yellow) for collagen-I and CD45. Bar is 50 μm. C and D, Quantification of the numbers of cells stained for collagen-I and CD45 (C), or α-SMA and CD45 (D). Values are means ± SEM, n = 3–6 per group. Significance was determined by ANOVA.
FIGURE 6
FIGURE 6
SAP injections reduce bleomycin-induced pulmonary fibrosis in mice. A, Percentage change in body weight in mice given intratracheal bleomycin alone (Bleo) or intratracheal bleomycin plus SAP (Bleo + SAP), compared with age-matched saline controls (Saline). B and C, SAP injections decrease pulmonary fibrosis (B) and percentage collagen content (C) in lungs of bleomycin-treated mice. Values are means ± SEM, n = 6. Significance was determined by ANOVA. D, Photomicrographs of H&E-stained sections of whole lungs from individual mice instilled with saline, bleomycin, or bleomycin, and then injected with murine SAP. Arrows point to areas of fibrosis. Each lung lobe was separated before being embedded in paraffin to facilitate analysis. Bars are 2 mm.
FIGURE 7
FIGURE 7
Delayed SAP injections reverse bleomycin-induced pulse Ox levels. Rats (n = 6–7 per group) were assessed for peripheral blood oxygen content (pulse Ox) at days 7 (A), 14 (B), and 21 (C). Values are means ± SEM. Significance was determined by ANOVA.
FIGURE 8
FIGURE 8
Delayed SAP injections reduce bleomycin-induced fibrosis in rat lungs. A, Whole right lungs were removed at day 21 and assessed for lung collagen content. Values are means ± SEM (n = 6–7 per group). B–F, Cryosections from day 21 rat lungs were stained with picrosirius red to show collagen deposition. B, Intratracheal instillation of saline; C and D, intratracheal instillation of bleomycin; E and F, intratracheal instillation of bleomycin and then delayed SAP injections. Asterisks indicate areas of fibrosis. Bars are 2 mm.
FIGURE 9
FIGURE 9
Delayed SAP injections reduce bleomycin-induced inflammation in rat lungs. A–C, Cryosections from day 21 rat lungs were stained with CD45 to show cellular inflammation. A, Intratracheal instillation of saline; B, intratracheal instillation of bleomycin; C, intratracheal instillation of bleomycin and then delayed SAP injections. Bars are 200 μm. D–F, Cryosections of rat lung were labeled with Abs against CD32, CD45, and CD68. Quantification of the numbers of cells stained for CD32 (D), CD45 (E), and CD68 (F). Values are means ± SEM (n = 4 for controls, n = 6 for bleo and bleo + SAP).

Similar articles

Cited by

References

    1. Crouch E. Pathobiology of pulmonary fibrosis. Am J Physiol. 1990;259:L159–L184. - PubMed
    1. Abid SH, Malhotra V, Perry MC. Radiation-induced and chemotherapy-induced pulmonary injury. Curr Opin Oncol. 2001;13:242–248. - PubMed
    1. Davies DE, Wicks J, Powell RM, Puddicombe SM, Holgate ST. Airway remodeling in asthma: new insights. J Allergy Clin Immunol. 2003;111:215–225. - PubMed
    1. Perez A, Rogers RM, Dauber JH. The prognosis of idiopathic pulmonary fibrosis. Am J Physiol. 2003;29:S19–S26. - PubMed
    1. Thannickal VJ, Toews GB, White ES, Lynch JP, III, Martinez FJ. Mechanisms of pulmonary fibrosis. Annu Rev Med. 2004;55:395–417. - PubMed

Publication types

MeSH terms