. 2008 Aug;7(4):245-62.
doi: 10.1007/s10237-007-0101-2. Epub 2007 Sep 2.

Growth and remodeling in a thick-walled artery model: effects of spatial variations in wall constituents

Affiliations

Growth and remodeling in a thick-walled artery model: effects of spatial variations in wall constituents

Patrick W Alford et al. Biomech Model Mechanobiol. 2008 Aug.

Abstract

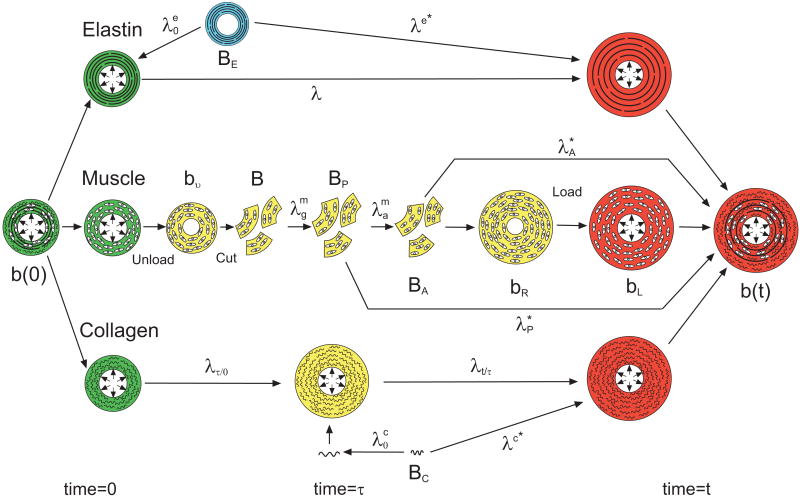
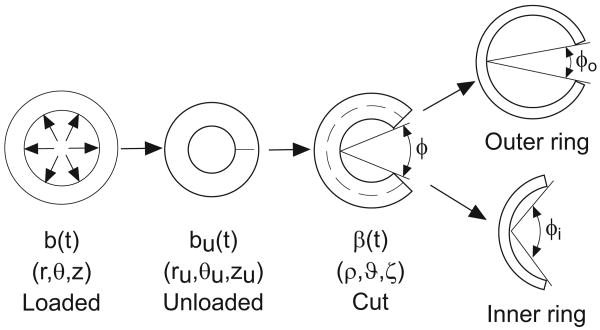
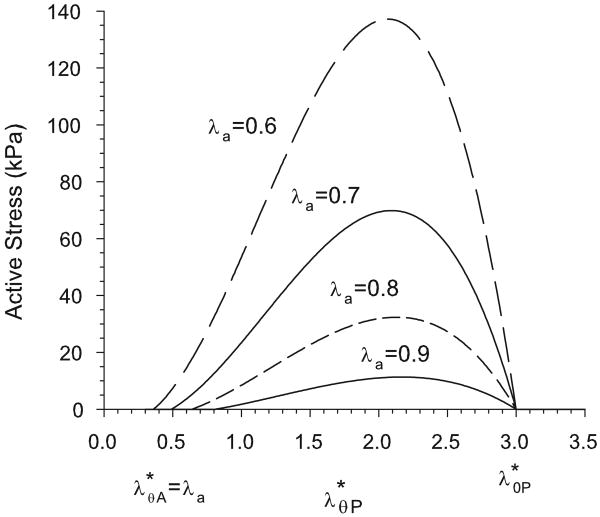
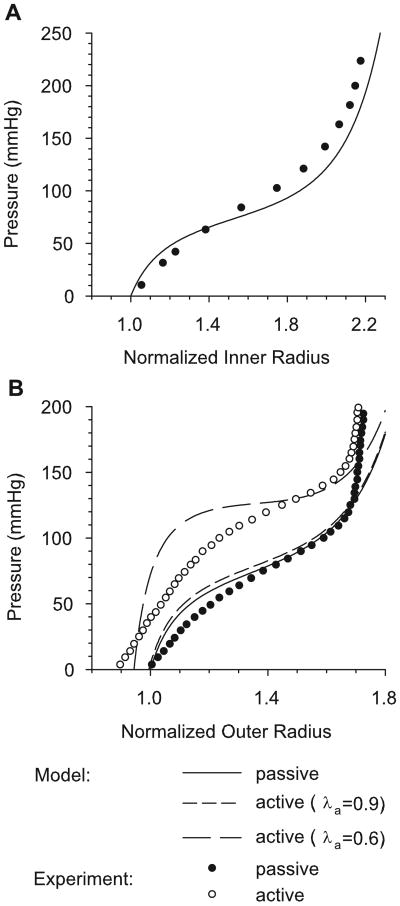
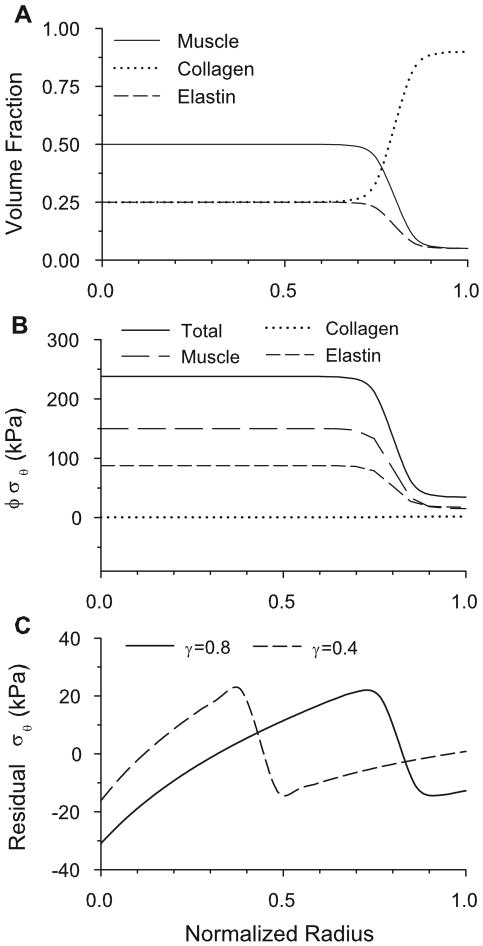
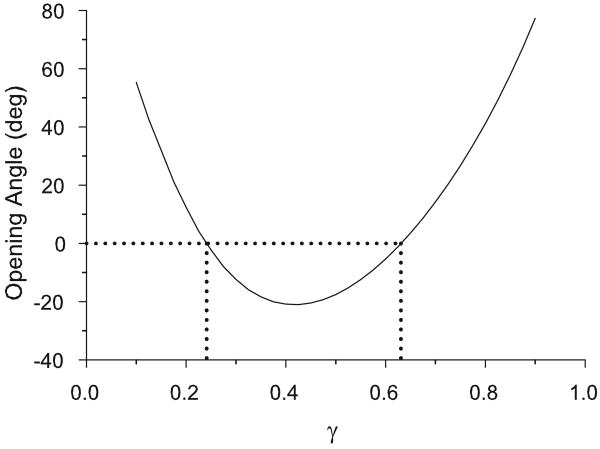
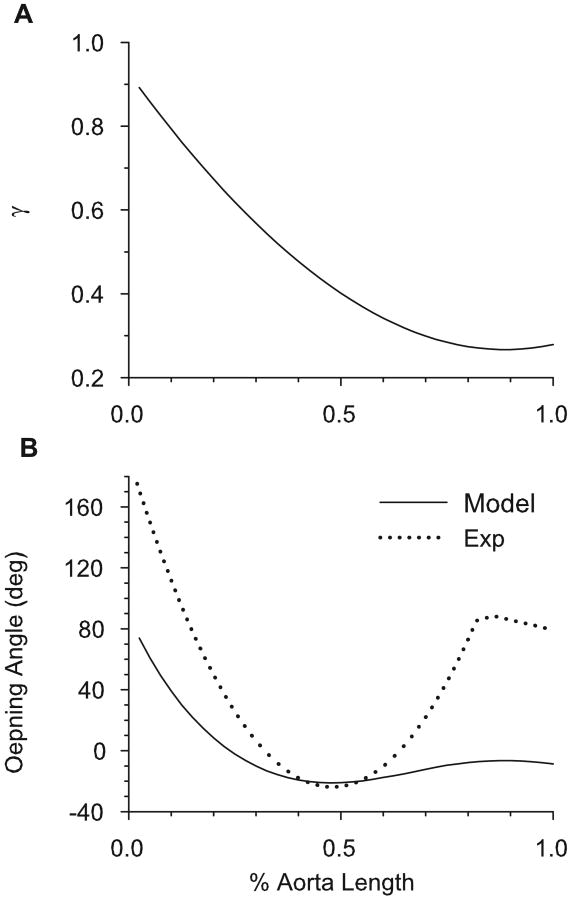
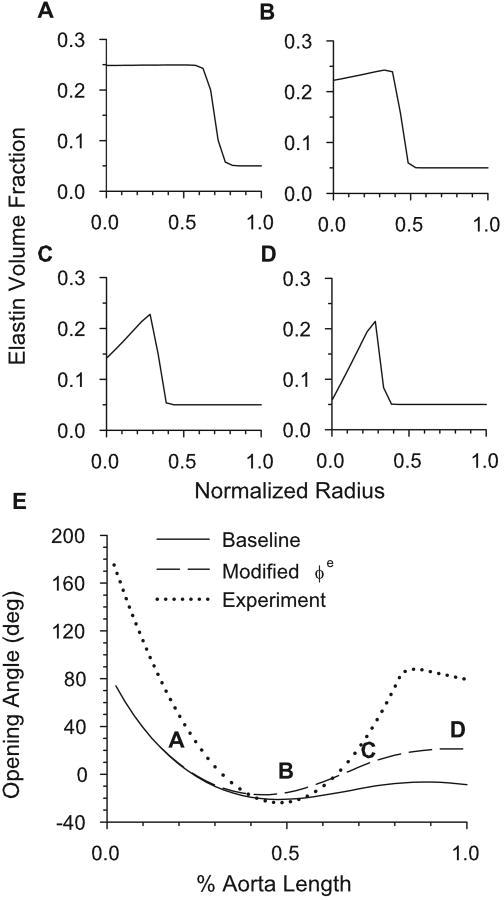
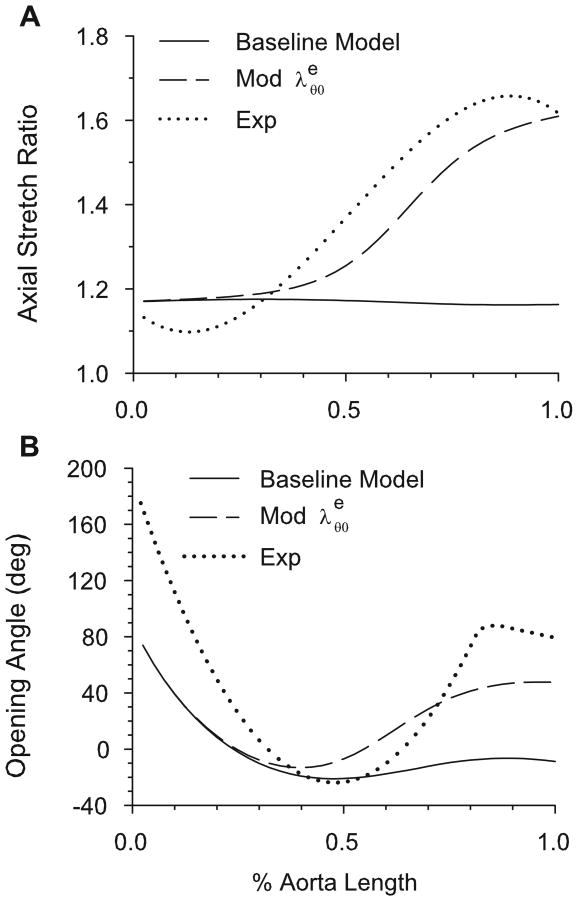
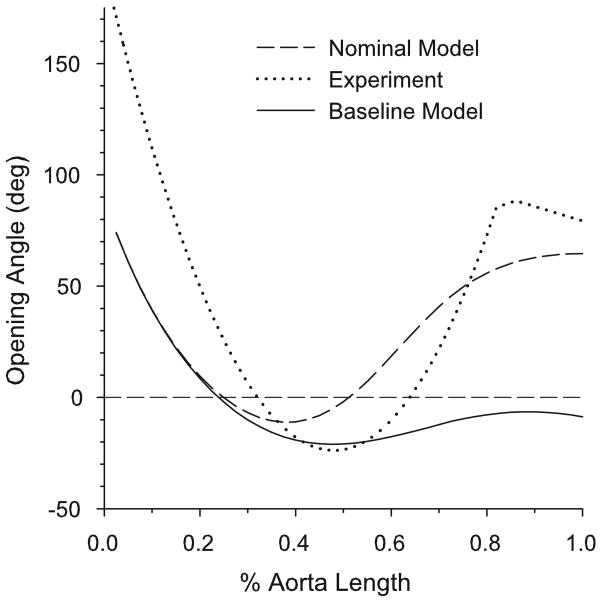
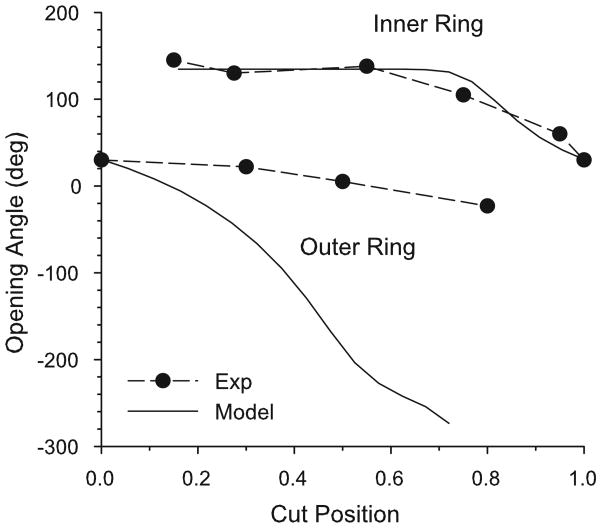
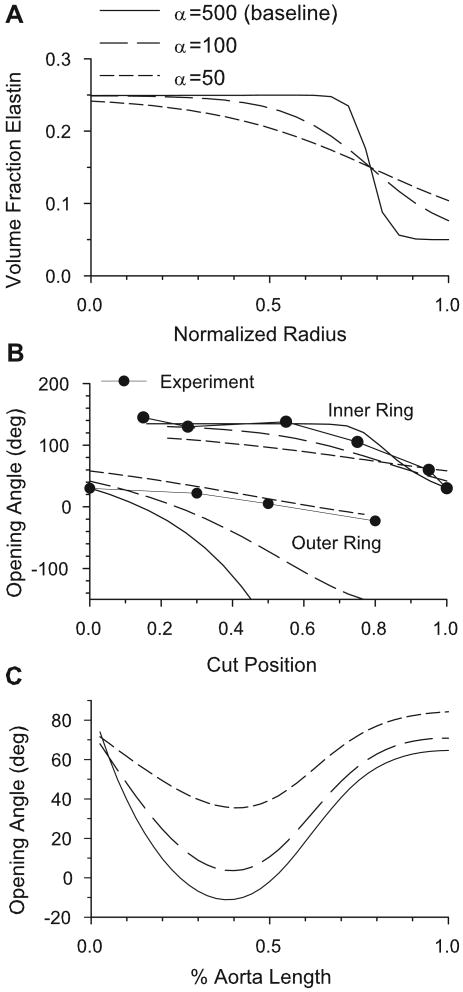
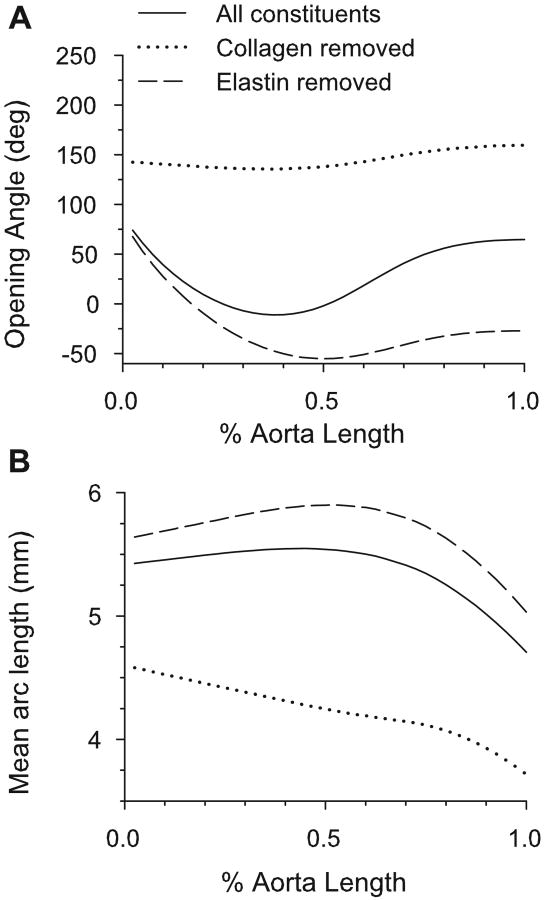
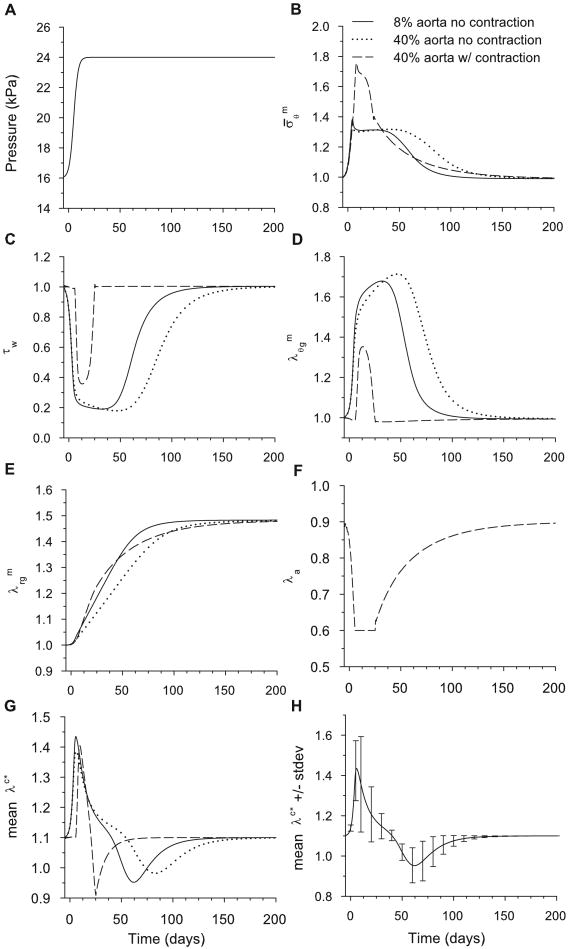
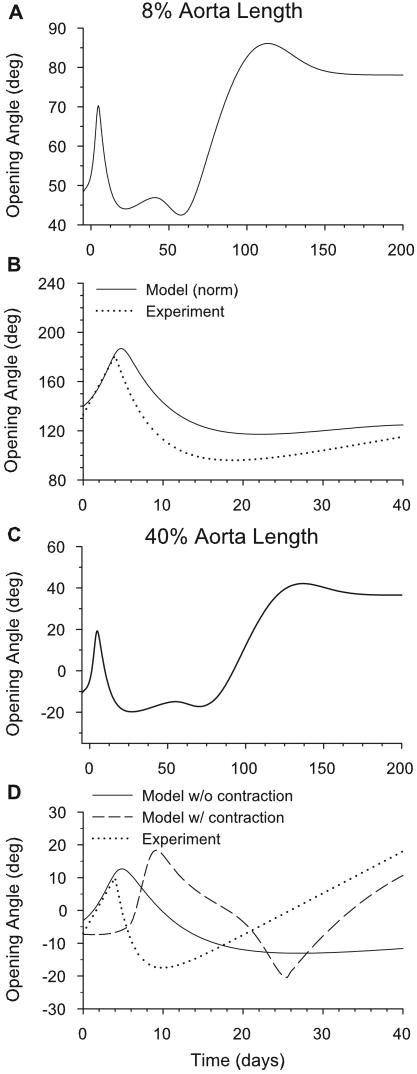
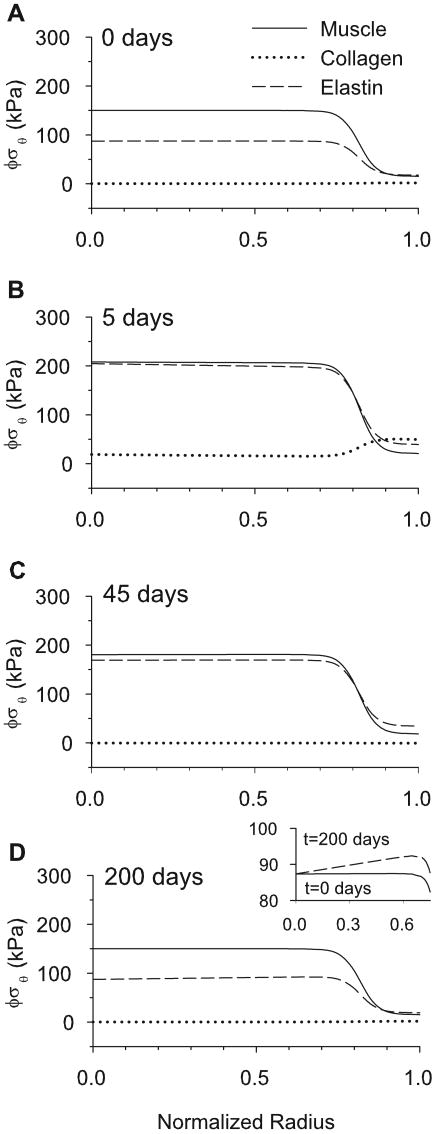
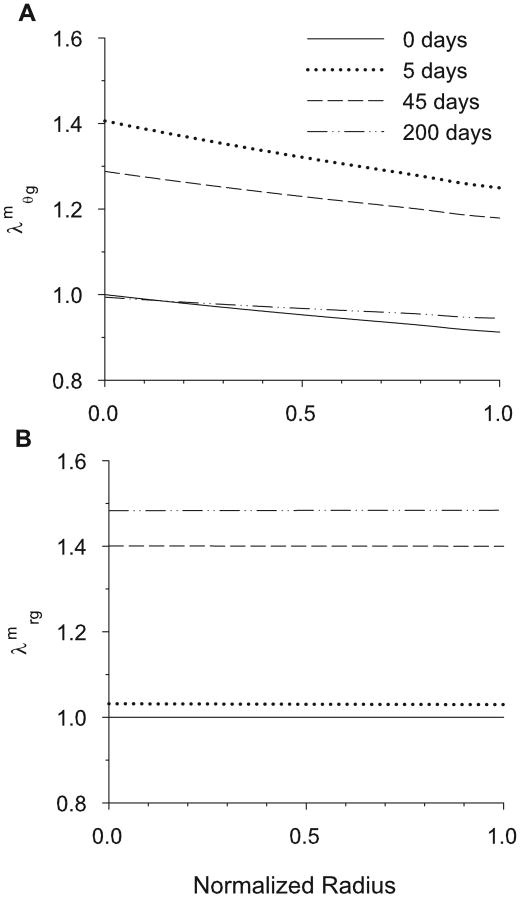
A mathematical model is presented for growth and remodeling of arteries. The model is a thick-walled tube composed of a constrained mixture of smooth muscle cells, elastin and collagen. Material properties and radial and axial distributions of each constituent are prescribed according to previously published data. The analysis includes stress-dependent growth and contractility of the muscle and turnover of collagen fibers. Simulations were conducted for homeostatic conditions and for the temporal response following sudden hypertension. Numerical pressure-radius relations and opening angles (residual stress) show reasonable agreement with published experimental results. In particular, for realistic material and structural properties, the model predicts measured variations in opening angles along the length of the aorta with reasonable accuracy. These results provide a better understanding of the determinants of residual stress in arteries and could lend insight into the importance of constituent distributions in both natural and tissue-engineered blood vessels.


Figures

Figure 1
Figure 1
Configurations for growth and remodeling. Each constituent (smooth muscle, elastin, and collagen) has its own natural (stress-free) configuration. Stress-free configurations are denoted by capital B's; stressed configurations are denoted by lower case b's. Stretch ratios are denoted by λ's. See text for details. In this figure, green denotes states at time = 0; red denotes states at time = t; yellow states occur at time τ where 0 ≤ τt; and blue denotes a state that occurred at a time < 0.
Figure 2
Figure 2
Schematic of opening angle experiments. Growth and remodeling in the loaded state (b) produce residual stress in the unloaded state (bu). When a transmural cut is made in the unloaded artery, relief of residual stress results in the opening angle (φ). When a circumferential cut (dashed line) is followed by a radial cut, the inner and outer rings open to different opening angles.
Figure 3
Figure 3
Active stress as a function of stretch ratio relative to the passive zero-stress state, as given by Eq. (18). Curves are shown for values of the activation stretch ratio λa ranging from 0.9 (normal tone) to 0.6 (maximum contraction). Note that active stress is zero when λθA=λa or λθP=λ0P=3.
Figure 4
Figure 4
Pressure-radius relations with radius normalized to the passive radius at zero pressure. (A) Numerical pressure-inner radius curve with experimental data of Berry et al. (1975) for rat aorta. (B) Numerical pressure-outer radius curves. Curves for passive muscle, normal contraction (λa = 0.9), and maximal contraction (λa = 0.6) are shown for γ = 0.8. Experimental data are from Fridez et al. (2002) for the rat carotid artery.
Figure 5
Figure 5
Results for homeostatic baseline model. (A) Constituent volume fraction distributions for γ = 0.8. (B) Circumferential partial and total stresses in loaded artery (γ = 0.8). (C) Residual total circumferential stress for γ = 0.8 and 0.4.
Figure 6
Figure 6
Opening angle vs media-adventitia boundary location (γ) for homeostatic baseline model. When the artery geometry is primarily made up of either adventitia (γ → 0) or media (γ → 1), the opening angle tends to be positive. When the media and adventitia are similar in size (γ ≈ 0.5), the opening angle is negative. For the parameter values used in this model, the opening angle is negative for γ ∈ [0.24, 0.63].
Figure 7
Figure 7
Opening angle based on realistic relative thickness of media and adventitia along entire aorta. (A) Specified media-adventitia boundary location (γ) along the length of the loaded aorta [based on Bunce (1974)]. (B) Opening angle along the length of the aorta, given by baseline model (with γ variation of (A) included) and the experimental results of Liu and Fung (1988).
Figure 8
Figure 8
Opening angle based on realistic transmural constituent distributions along aorta. (A-D) Modified transmural distribution of elastin for the four locations along the aorta defined in E. (E) Effects of specified elastin variations on opening angle. Experimental results of Liu and Fung (1988) are also shown.
Figure 9
Figure 9
Axial stretch and opening angle based on realistic axial elastin stretch ratio ( λθ0e) along aorta. In modified aorta, λθ0e increases from the arch to the abdominal aorta. (A) Numerical and experimental (Guo et al., 2001) axial stretch ratios of the loaded intact aorta relative to the unloaded dissected aorta. (B) Effects of axial elastin stretch ( λθ0e) variation on opening angle. Experimental data of Liu and Fung (1988) are also shown.
Figure 10
Figure 10
Opening angles along the length of the aorta given by the nominal model (including variations highlighted in Sections 5.2 and 5.3), baseline model (with only media-adventitia boundary varied as in Fig. 7A), and experimental results of Liu and Fung (1988).
Figure 11
Figure 11
Two-cut opening angles at 12.5% distance along the nominal aorta model and experimental measurements of Greenwald et al. (1997) for bovine carotid artery. The cut position indicates the normalized location of the circumferential cut from the inner radius (0) to the outer radius (1).
Figure 12
Figure 12
Effects of sharpness of media-adventitia boundary on opening angles. (A) Transmural elastin volume fractions for the three values of α. As α increases, the boundary becomes sharper. (B) Two-cut opening angles for the three values of α at 12.5% aorta length in the nominal model. As α decreases, the numerical results come into closer agreement with the experimental data of Greenwald et al. (1997). (C) One-cut opening angles along the length of the aorta for the three values of α.
Figure 13
Figure 13
Model predictions for arteries in which elastin or collagen has been digested. (A) Opening angles for elastase and collagenase treated aorta. (B) Mean arc lengths of cut artery for elastase and collagenase treated aorta.
Figure 14
Figure 14
Stresses and stretch ratios for time-dependent model following a 50% increase in pressure from the homeostatic state. The stresses σ¯θm and τ¯w are normalized relative to homeostatic values. Legend in (B) applies also for (C-H). (A) Psuedo-step increase in pressure specified as a function of time. (B) Circumferential muscle stress at inner radius. (C) Endothelial fluid shear stress. (D,E) Circumferential and radial growth stretch ratios at inner radius. Note that λθgm returns to unity (no net growth) only at the inner radius. (F) Activation stretch ratio at inner radius. (G) Mean collagen stretch ratio in artery wall. (H) Mean and standard deviation of stretch ratio for collagen across the wall at 8% aorta length.
Figure 15
Figure 15
Time-dependent opening angles following a 50% increase in pressure from the homeostatic state. Opening angles are shown at 8% (A,B) and 40% (C,D) of the aorta length. Normalized model results (relative to value at t = 0) are compared with experimental data of Fung and Liu (1989) in (B) and (D). The effects of smooth muscle contraction are shown for the model in (D).
Figure 16
Figure 16
Transmural partial stresses of smooth muscle, collagen and elastin during growth and remodeling before and after a 50% pressure jump. (A) Partial stresses immediately preceding the pressure jump at 8% aorta length. (B) Partial stress distributions five days after the pressure jump begins. (C) Partial stress distributions 45 days after the pressure jump. (D) Fully grown and remodeled partial stresses, 200 days after the pressure jump. Stresses are similar to those in A, but the elastin gradient is slightly altered, as shown in the expanded scale of the inset.
Figure 17
Figure 17
Cross-sectional circumferential and radial smooth muscle growth 0, 5, 45 and 200 days after a 50% pressure jump at 8% aorta length. (A) Cirucmferential muscle growth ( λθgm). (B) Radial muscle growth ( λθrm).

References

    1. Berry C, Greenwald SE, Rivett JF. Static mechanical properties of the developing and mature rat aorta. Cadiovasc Res. 1975;9:669–678. - PubMed
    1. Bunce DFM. Atlas of Arterial Histology. Warren H. Green, Inc.; St Louis, MO: 1974.
    1. Conte MS. The ideal small arterial substitute: a search for the Holy Grail? FASEB J. 1998;12:43–45. - PubMed
    1. Cox RH. Arterial wall mechanics and composition and the effects of smooth muscle activation. Am J Physiol. 1975;229:807–812. - PubMed
    1. Davidson JM, Hill KE, Alford JL. Developmental changes in collagen and elastin biosynthesis in the porcine aorta. Dev Biol. 1986;118:103–111. - PubMed

Publication types

LinkOut - more resources