Review
. 2007;39(2-3):581-97.
doi: 10.1080/03602530701497804.

LC-MS-based metabolomics in drug metabolism

Affiliations
Review

LC-MS-based metabolomics in drug metabolism

Chi Chen et al. Drug Metab Rev. 2007.

Abstract

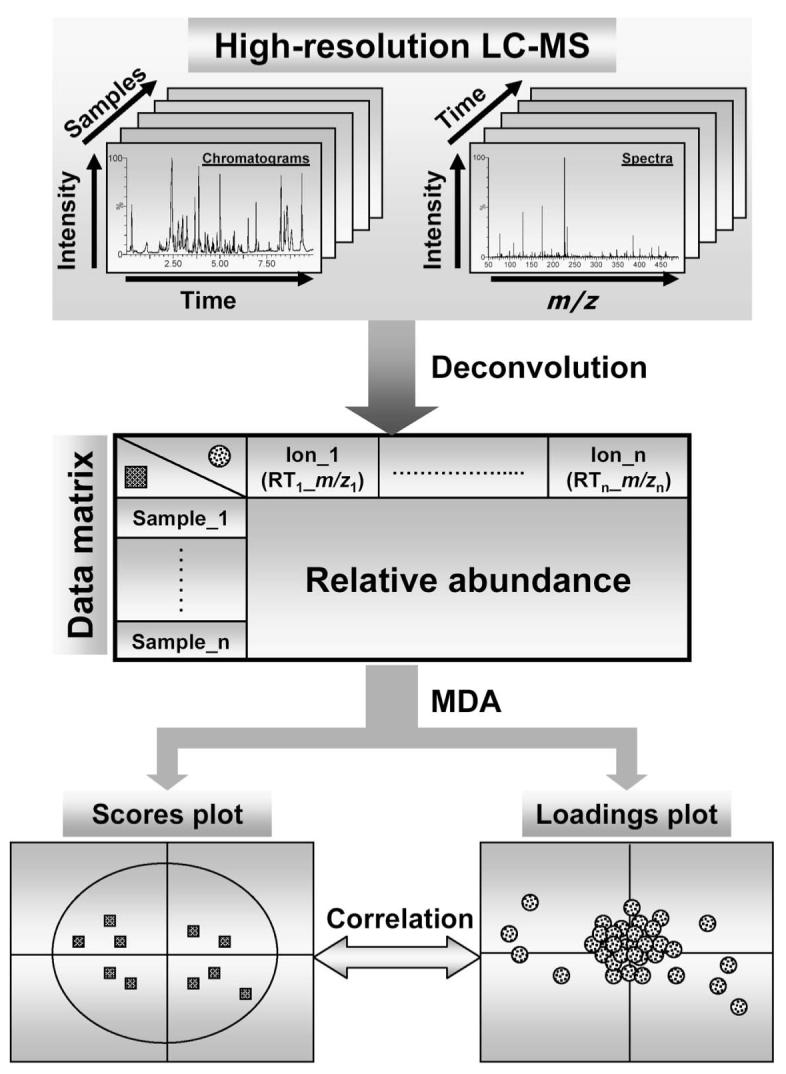
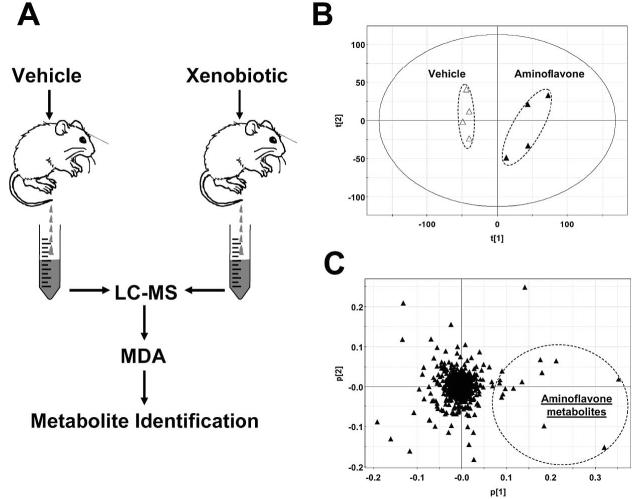
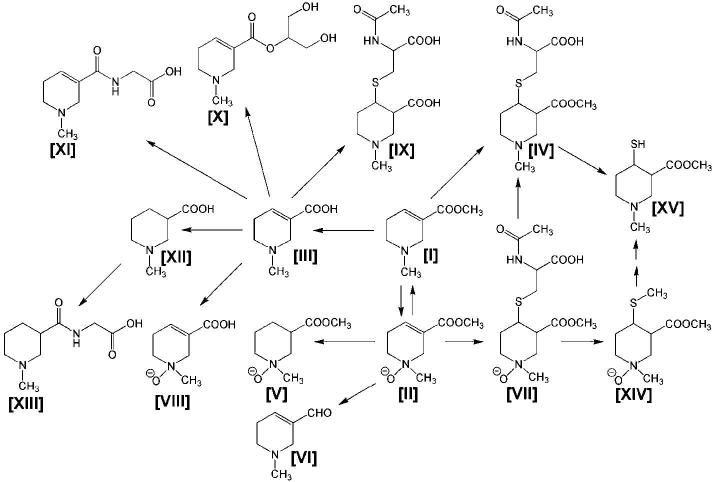
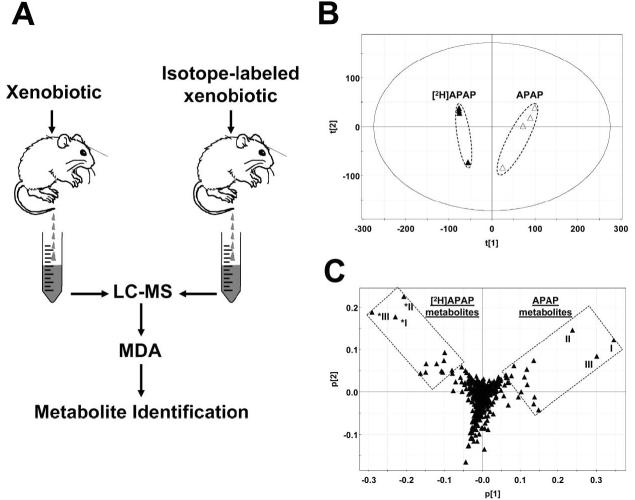
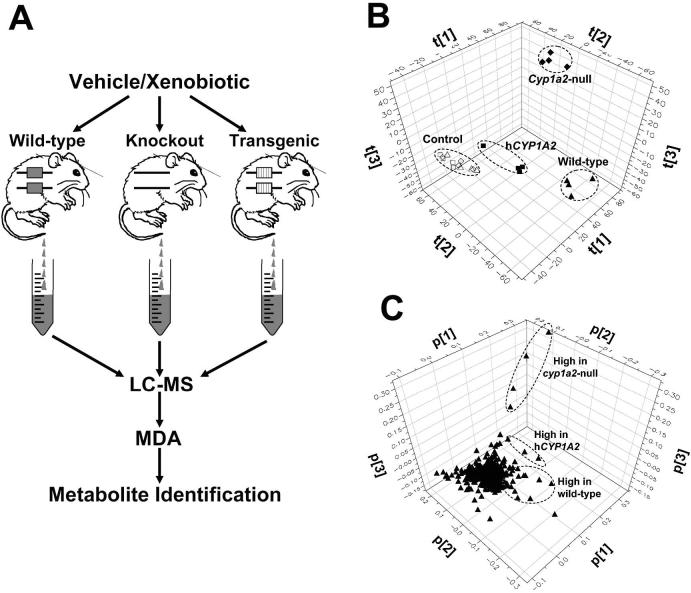
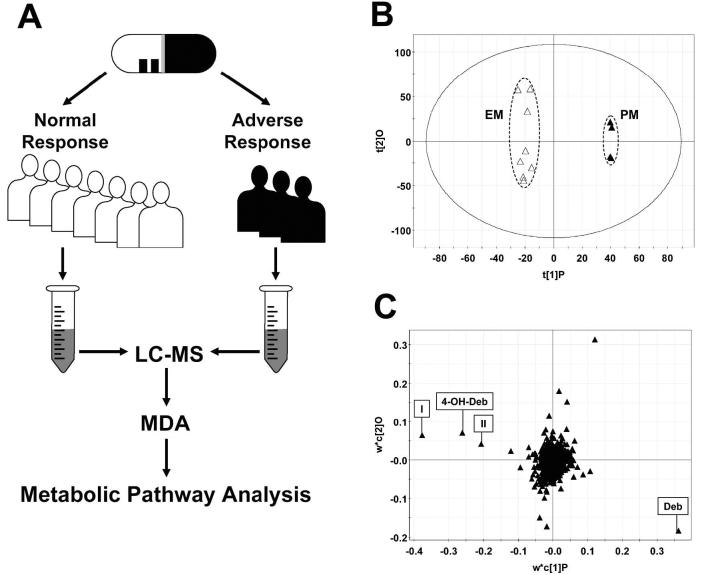
Xenobiotic metabolism, a ubiquitous natural response to foreign compounds, elicits initiating signals for many pathophysiological events. Currently, most widely used techniques for identifying xenobiotic metabolites and metabolic pathways are empirical and largely based on in vitro incubation assays and in vivo radiotracing experiments. Recent work in our lab has shown that LC-MS-based metabolomic techniques are useful tools for xenobiotic metabolism research since multivariate data analysis in metabolomics can significantly rationalize the processes of xenobiotic metabolite identification and metabolic pathway analysis. In this review, the technological elements of LC-MS-based metabolomics for constructing high-quality datasets and conducting comprehensive data analysis are examined. Four novel approaches of using LC-MS-based metabolomic techniques in xenobiotic metabolism research are proposed and illustrated by case studies and proof-of-concept experiments, and the perspective on their application is further discussed.


Figures

Figure 1
Figure 1
Procedures of LC-MS-based metabolomics. Chromatographic and spectral data are acquired by high-resolution LC-MS. Subsequent data processing, such as centroiding, deisotoping, filtering, peak recognition, yields a data matrix containing information on sample identity, ion identity (RT and m/z) and ion abundance. With appropriate data transformation and scaling, a multivariate model can be established through unsupervised or supervised MDA. The scores plot illustrates the principal or latent components of the model and sample classification, while the loadings plot presents the contribution of each ion to each principal component of the MDA model.
Figure 2
Figure 2
Metabolite identification through metabolomic comparison between vehicle treatment and xenobiotic treatment. A. Experimental scheme. Samples for LC-MS measurement are collected after dosing animals with vehicle or xenobiotic. Metabolite identification is conducted after MDA (in most cases, unsupervised PCA) of LC-MS data. B. A scores plot of a PCA analysis on 24-h mouse urine samples from vehicle (△) and 50 mg/kg aminoflavone (▲) treatment. The t[1] and t[2] values represent the scores of each sample in principal component 1 and 2, respectively. LC-MS measurement was conducted using UPLC-QTOFMS (Waters), data processing using MarkerLynx™ (Waters), and MDA using SIMCA-P+ software (Umetrics). Data are adopted from an aminoflavone metabolism study (Chen et al., 2006). C. Loadings plot of chemical ions in the urine samples from vehicle and aminoflavone treatment. The p[1] and p[2] values represent the contributing weights of each ion to principal components 1 and 2 of the PCA model, respectively.
Figure 3
Figure 3
Metabolic map of the areca alkaloid arecoline constructed from metabolomic studies in mice with arecoline, arecaidine, and the arecoline principal metabolite arecoline 1-oxide. The metabolites of arecoline [I] depicted are arecoline 1-oxide [II], arecaidine [III], arecoline N-acetylcysteine conjugate [IV], N-methylnipecotic acid 1-oxide methyl ester [V], the aldehyde metabolite of arecoline [VI], arecoline 1-oxide N-acetylcysteine conjugate [VII], arecaidine 1-oxide [VIII], arecaidine N-acetylcysteine conjugate [IX], arecaidine glycerol conjugate [X], arecaidine glycine conjugate [XI], N-methylnipecotic acid [XII], N-methylnipecotic acid glycine conjugate [XIII], the 4-methylthiol of arecoline 1-oxide [XIV], and the 4-thiol of arecoline 1-oxide [XV]. Details of diastereomeric metabolites have been published elsewhere (Giri et al., 2007).
Figure 4
Figure 4
Metabolite identification through metabolomic comparison between unlabeled xenobiotic treatment and stable isotope-labeled xenobiotic treatment. A. Experimental scheme. Samples for LC-MS measurement are collected after dosing animals with unlabeled or stable isotope-labeled xenobiotic. Metabolite identification is conducted after MDA (in most cases, unsupervised PCA) of LC-MS data. B. Scores plot of a proof-of-concept PCA analysis on 24-h mouse urine samples from 400 mg/kg APAP (△) and 400 mg/kg deuterated APAP (▲) treatment. The t[1] and t[2] values represent the scores of each sample in principal components 1 and 2, respectively. LC-MS measurement was conducted using UPLC-QTOFMS (Waters), data processing using Marker-Lynx™ (Waters), and MDA using SIMCA-P+ software (Umetrics). C. Loadings plot of chemical ions in the urine samples from APAP and deuterated APAP treatment. The p[1] and p[2] values represent the contributing weights of each ion to principal components 1 and 2 of PCA model, respectively.
Figure 5
Figure 5
Identification of metabolic pathways through metabolomic comparison among wild-type and genetically-modified mice. A. Experimental scheme. Samples for LC-MS measurement are collected after dosing wild-type, knockout and transgenic mice with vehicle or xenobiotic. Identification of metabolites and analysis of metabolic pathways are conducted after MDA (supervised or unsupervised) of LC-MS data. B. Scores plot of a PCA analysis on 24-h mouse urine samples from vehicle treatment (wild-type: △; Cyp1a2-null: ◇; CYP1A2-humanized:□) and 10 mg/kg PhIP treatment (wild-type:▲ Cyp1a2-null: ◆; CYP1A2-humanized: ■). The t[1], t[2], and t[3] values represent the scores of each sample in principal components 1, 2, 3, respectively. LC-MS measurement was conducted using UPLC-QTOFMS (Waters), data processing using MarkerLynx™ (Waters), and MDA using SIMCA-P+ software (Umetrics). Data are adopted from an PhIP metabolism study (Chen et al., 2007). C. Loadings plot of ions in the urine samples from wild-type, Cyp1a2-null and CYP1A2-humanized mice treated with vehicle and PhIP. The p[1], p[2] and p[3] values represent the contributing weights of each ion to principal components 1, 2, 3 of PCA model, respectively.
Figure 6
Figure 6
Metabolomic approach for identifying human XME polymorphism responsible for ADR. A. Experi-mental scheme. Samples for LC-MS measurement are collected from the patients with normal response to the drug and the patients with ADR to the drug. Identification of metabolites and analysis of metabolism pathway are conducted after MDA (in most cases, supervised) of LC-MS data. B. Scores plot of a proof-of-concept OPLS analysis on 8-h urine samples from extensive metabolizers (△) and poor metabolizers (▲) treated with 10 mg debrisoquine. The t[1]P and t[2]O values represent the scores of each sample in principal component 1 (predictive component) and 2 (orthogonal component), respectively. LC-MS measurement was conducted using UPLCQTOFMS (Waters), data processing using MarkerLynx™ (Waters), and MDA using SIMCA-P+ software (Umetrics). Data are adopted from a debrisoquine metabolism study (Zhen et al., 2006). C. Loadings plot of ions in the human urine samples after debrisoquine treatment. The w*c[1]P and w*c[2]O values represent the contributing weights of each ion to principal components 1 (predictive component) and 2 (orthogonal component) of the OPLS model, respectively.

Similar articles

Cited by

References

    1. Allen JG, Brown AN, Marten TR. Metabolism of debrisoquine sulphate in rat, dog and man. Xenobiotica. 1976;6:405–409. - PubMed
    1. Allen JG, East PB, Francis RJ, Haigh JL. Metabolism of debrisoquine sulfate. Identification of some urinary metabolites in rat and man. Drug Metab. Dispos. 1975;3:332–337. - PubMed
    1. Ando Y, Saka H, Ando M, Sawa T, Muro K, Ueoka H, Yokoyama A, Saitoh S, Shimokata K, Hasegawa Y. Polymorphisms of UDP-glucuronosyltransferase gene and irinotecan toxicity: a pharmacogenetic analysis. Cancer Res. 2000;60:6921–6926. - PubMed
    1. Brindle JT, Antti H, Holmes E, Tranter G, Nicholson JK, Bethell HW, Clarke S, Schofield PM, McKilligin E, Mosedale DE, Grainger DJ. Rapid and noninvasive diagnosis of the presence and severity of coronary heart disease using 1H-NMR-based metabonomics. Nat. Med. 2002;8:1439–1444. - PubMed
    1. Brodie BB, Axelrod J. The Fate of Acetanilide in Man. J. Pharmacol. Exp. Ther. 1948;94:29. - PubMed

Publication types