. 2007 Sep 4;5(10):e254.
doi: 10.1371/journal.pbio.0050254.

The diploid genome sequence of an individual human

Affiliations

The diploid genome sequence of an individual human

Samuel Levy et al. PLoS Biol. .

Abstract

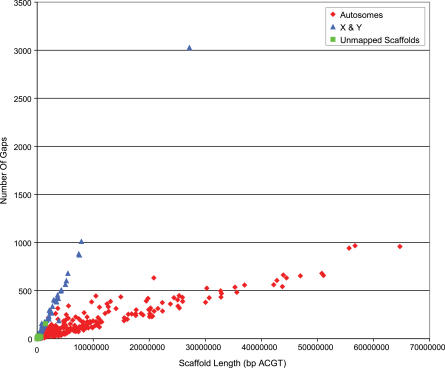
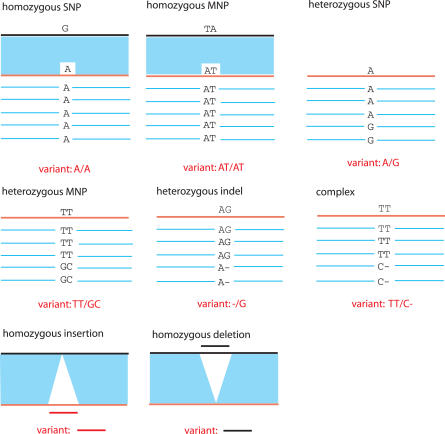
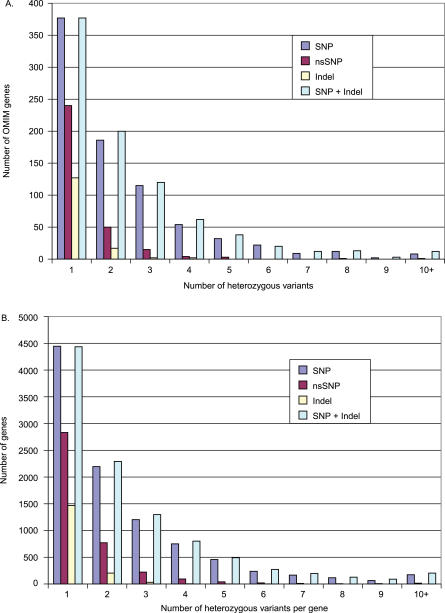
Presented here is a genome sequence of an individual human. It was produced from approximately 32 million random DNA fragments, sequenced by Sanger dideoxy technology and assembled into 4,528 scaffolds, comprising 2,810 million bases (Mb) of contiguous sequence with approximately 7.5-fold coverage for any given region. We developed a modified version of the Celera assembler to facilitate the identification and comparison of alternate alleles within this individual diploid genome. Comparison of this genome and the National Center for Biotechnology Information human reference assembly revealed more than 4.1 million DNA variants, encompassing 12.3 Mb. These variants (of which 1,288,319 were novel) included 3,213,401 single nucleotide polymorphisms (SNPs), 53,823 block substitutions (2-206 bp), 292,102 heterozygous insertion/deletion events (indels)(1-571 bp), 559,473 homozygous indels (1-82,711 bp), 90 inversions, as well as numerous segmental duplications and copy number variation regions. Non-SNP DNA variation accounts for 22% of all events identified in the donor, however they involve 74% of all variant bases. This suggests an important role for non-SNP genetic alterations in defining the diploid genome structure. Moreover, 44% of genes were heterozygous for one or more variants. Using a novel haplotype assembly strategy, we were able to span 1.5 Gb of genome sequence in segments >200 kb, providing further precision to the diploid nature of the genome. These data depict a definitive molecular portrait of a diploid human genome that provides a starting point for future genome comparisons and enables an era of individualized genomic information.


Conflict of interest statement

Competing interests. The authors have declared that no competing interests exist.

Figures

Figure 1
Figure 1. DNA Donor Pedigree and Relatedness to Ethnogeographic Populations
(A) Three-generation pedigree showing the relation of ancestors to study DNA sample. The donor is identified in red. (B) Cluster analysis based on 750 SNP genotype information to infer the ancestry of the HuRef donor. The figure shows the proportion of membership of the HuRef donor (yellow) to three pre-defined HapMap populations (CEU = Northern and Western Europe, YRI = Yoruban, Ibadan, Nigeria, and JPT+CHB = Japanase, Tokyo, and Han Chinese, Beijing). The results indicate that the HuRef donor clusters with 99.5% similarity to the samples of northern and western European ancestry.
Figure 2
Figure 2. Results of Cytogenetic Analysis
(A) HuRef donor G-banded karyotype. (B) Spectral karyotype analysis.
Figure 3
Figure 3. Sequencing Continuity Plot for the HuRef Autosomes Compared to HuRef X and Y Chromosomes
Note that the autosomes have more contiguous sequence with fewer gaps compared to chromosomes X and Y, probably due to half the read depth compared to the autosomes and the presence of extensive sequence similarity between the sex chromosomes.
Figure 4
Figure 4. The Different Variant Types Identified from the HuRef Assembly and the HuRef-NCBI Assembly-to-Assembly Mapping
HuRef consensus sequence (in red) with underlying sequence reads (in blue). Homozygous variants are identified by comparing the HuRef assembly with NCBI reference assembly. Heterozygous variants are identified by base differences between sequence reads. SNP = single nucleotide polymorphism; MNP = multi-nucleotide polymorphism, which contains contiguous mismatches.
Figure 5
Figure 5. Diversity for SNPs and Indels in Autosomes
This is most likely an under-estimate of the true diversity, because a fraction of real heterozygotes were missed due to insufficient read coverage.
Figure 6
Figure 6. Distribution of Indel Length in the HuRef Genome
Distributions of heterozygous (A) and homozygous (B) indels lengths of 1–100 bp (A and B, respectively) and at greater detail in the range 1–20 bp (C and D, respectively). Note that heterozygous indels range from 1–321 bp and homozygous indels between 1–82,711 bp, however both polymorphisms type have greater than 47% of indel events being single base. Also even-length indels appear to be overrepresented.
Figure 7
Figure 7. Number and Length Distribution of Apparent Homozygous Insertion and Deletion Sequences Greater than 100 bp
Note that the number of indel events are similar but that there are more longer insertions than deletions.
Figure 8
Figure 8. Modeling the Rate of SNP Detection from Microarray Experiments
Model of the false-negative rate of heterozygous SNP detection found on Affymetrix or Illumina genotyping platforms in relation to the number of supporting reads found in the HuRef assembly at these loci. The observed false-negative rate of detected heterozygous SNPs in the HuRef assembly closely follows the modeled rate given a Poisson model. The predicted false-negative error is based on the thresholds of requiring at least 20% of the reads supporting the minor allele, two reads minimum. The increased false-negative error at 11 is due to the increased number of reads required to call the minor allele compared to two reads being required at 4×–10× coverage. Therefore, at 11×–15× coverage, three reads are required. The additional read changes the binomial distribution and increases false-negative error (See Materials and Methods).
Figure 9
Figure 9. Distribution of HuRef Read-Depth Coverage for Genotyped SNPs
Distribution plot of number of underlying reads (average number of reads = 8.8) in HuRef heterozygous SNPs confirmed by the Affymetrix and Illumina genotyping platforms. This is compared to a distribution (average number of reads = 5.2) for SNP detected by the platforms but missed in the HuRef assembly.
Figure 10
Figure 10. Non-Mapped HuRef Sequences Mapped to Coriell DNA Samples by FISH
Sequences from the HuRef donor that had no match based on the one-to-one mapping or BLAST when compared to the NCBI Human reference genome were tested by FISH. Fosmids were used as probes and the experiments were run, using Coriell DNA, to confirm the localization of the contigs or to map contigs with no prior mapping information. Shown here are four representative results. (A) An insertion at 7q22 where the FISH confirmed the HuRef mapping, (B) FISH result confirming the mapping of a sequence extending into a gap at 1p21. (C) Localization of a contig with no prior mapping information to chromosomal band 1q42. (D) An example of euchromatic-like sequence with no prior mapping information, which hybridizes to multiple centromeric locations.
Figure 11
Figure 11. Degree of Linkage of Heterozygous Variants
The distribution of the number of other variants to which a given variant can be linked using sequencing reads only or using mated reads as well is shown. Linkage of variants based on individual sequencing reads is limited, regardless of sequence coverage beyond a modest level, but is substantially increased by the incorporation of mate pairing information. The size of the effect is considerably more than simply doubling read length, due to variation in insert size; consequently, benefits of increasing sequencing coverage drop off much more slowly.
Figure 12
Figure 12. Distribution of Inferred Haplotype Sizes
(A) Reverse cumulative distribution of haplotype spans (bp) (N50 ∼ 350 kb). (B) Reverse cumulative distribution of variants per haplotype (N50 ∼ 400 variants).
Figure 13
Figure 13. Consistency of HuRef Haplotypes with HapMap Data
Haplotypes inferred from the HuRef data are strongly consistent with HapMap haplotypes. The probability in the HapMap CEU panel of the observed genotypes being phased as per the HuRef haplotypes is high for variants in strong LD (as measured either by D′ or r 2).
Figure 14
Figure 14. Distribution of HuRef Variants in OMIM and Ensembl Genes
(A) The distribution of the OMIM genes in Ensembl version 41 protein coding genes that contain one or more SNP or indel in their coding and/or UTR regions. (B) A similar distribution for the variants found in coding and/or UTR regions for all Ensembl version 41 genes.
Figure 15
Figure 15. Chromosome Y ethno-genogeographic lineage
The HuRef donor Y chromosome haplotype suggests descent from several European/US groups given the Y chromosome ethno-geographic markers. The haplogroup membership is R1b6 with includes individuals from the United Kingdom, Germany, Russia, and the United States, which is consistent with the self-reported family tree provided by the HuRef donor. The thick red line denotes the markers needed to trace the haplotype from the mapping of the chromosome Y markers to the HuRef genome. Data and figure from the Y Chromosome Consortium; http://ycc.biosci.arizona.edu/nomenclature_system/frontpage.html.

Comment in

References

    1. Painter TS. The sex chromosomes of man. Am Nat. 1924;58:506–524.
    1. Tjio TH, Levan A. The chromosome number of man. Hereditas. 1956;42:1.
    1. Lejeune J, Turpin R. Chromosomal aberrations in man. Am J Hum Genet. 1961;13:175–184. - PMC - PubMed
    1. Caspersson T, Zech L, Johansson C, Modest EJ. Identification of human chromosomes by DNA-binding fluorescent agents. Chromosoma. 1970;30:215–227. - PubMed
    1. Fodor SP, Read JL, Pirrung MC, Stryer L, Lu AT, et al. Light-directed, spatially addressable parallel chemical synthesis. Science. 1991;251:767–773. - PubMed

Publication types

MeSH terms