. 2007 Sep 7;130(5):863-77.
doi: 10.1016/j.cell.2007.08.029.

Exonuclease-1 deletion impairs DNA damage signaling and prolongs lifespan of telomere-dysfunctional mice

Affiliations

Exonuclease-1 deletion impairs DNA damage signaling and prolongs lifespan of telomere-dysfunctional mice

Sonja Schaetzlein et al. Cell. .

Erratum in

  • Cell. 2007 Oct 5;131(1):190. Kuhnel, Florian [added]

Abstract

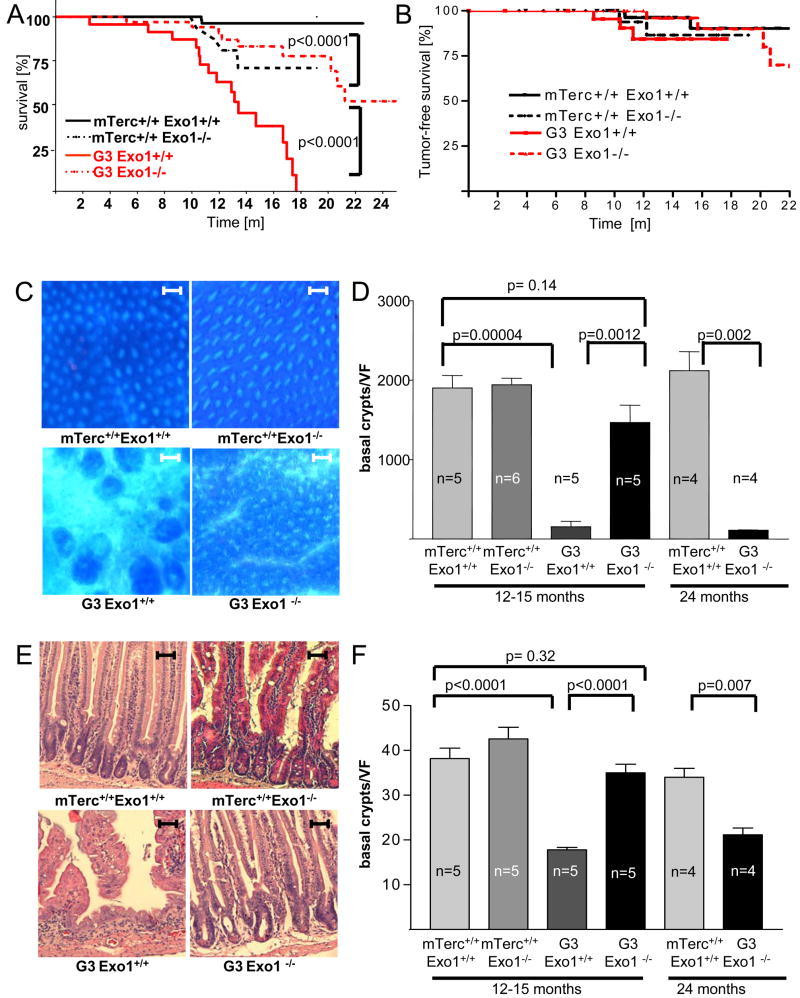
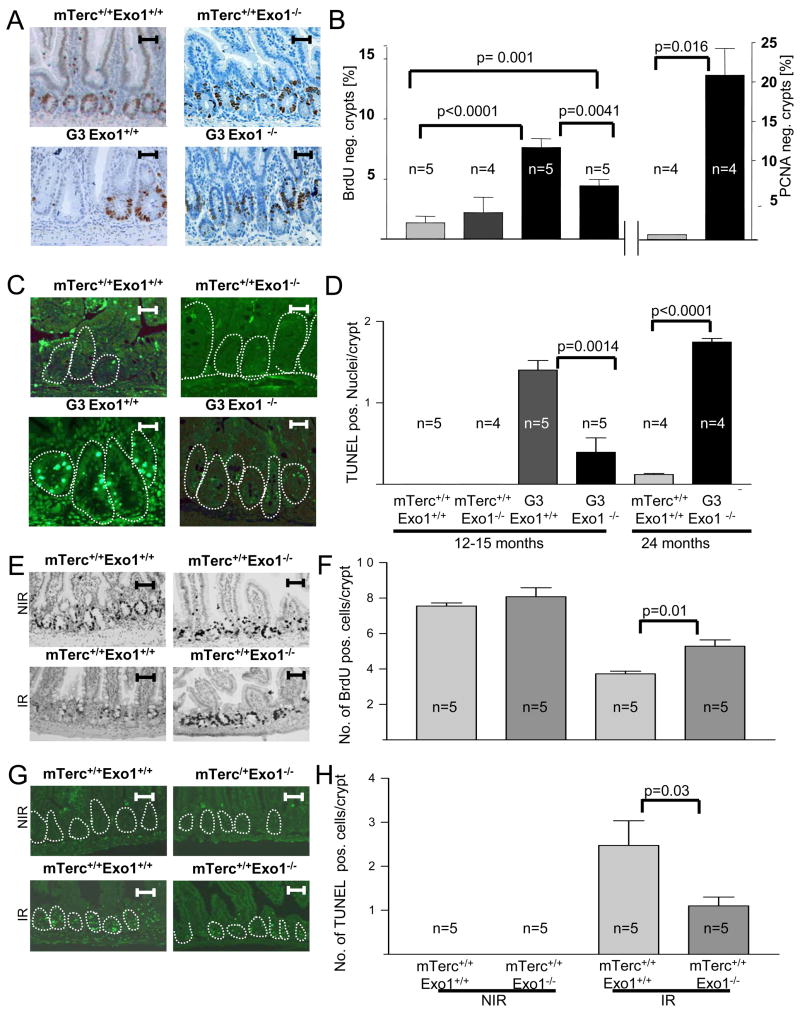
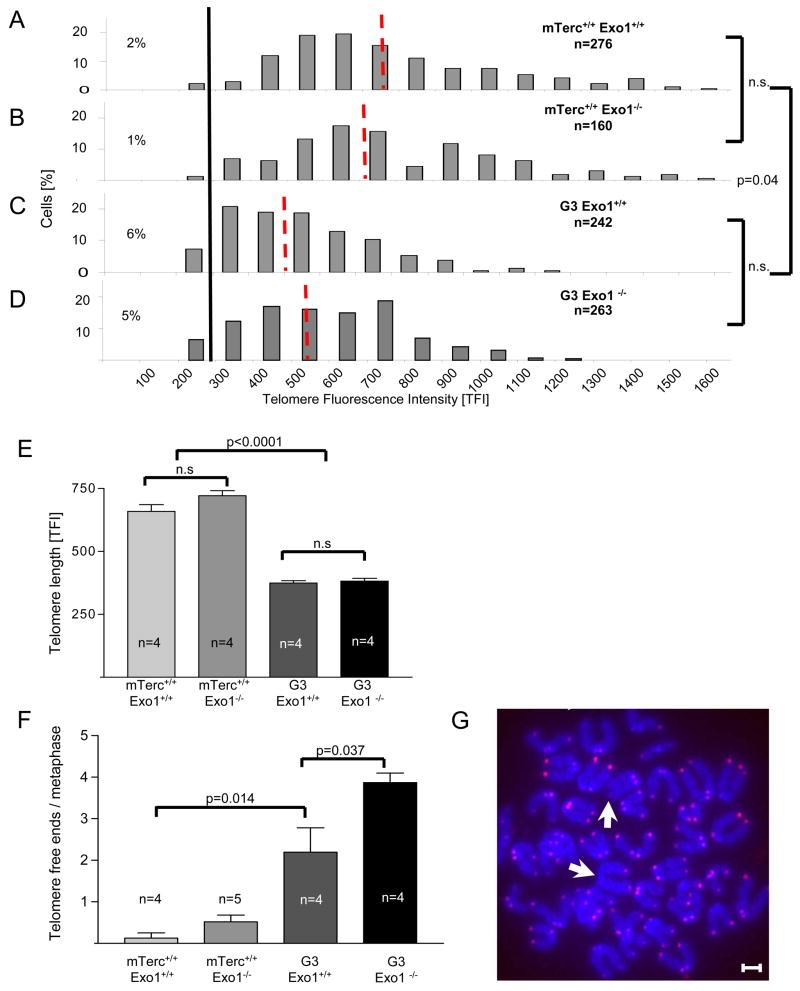
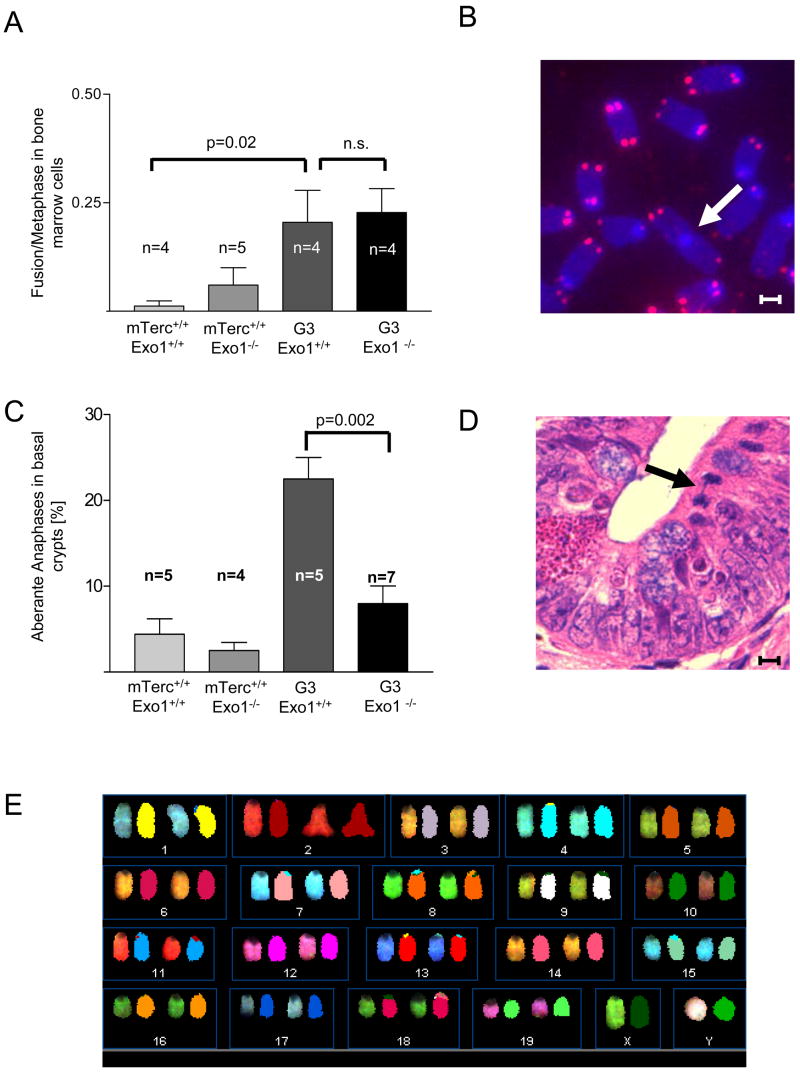
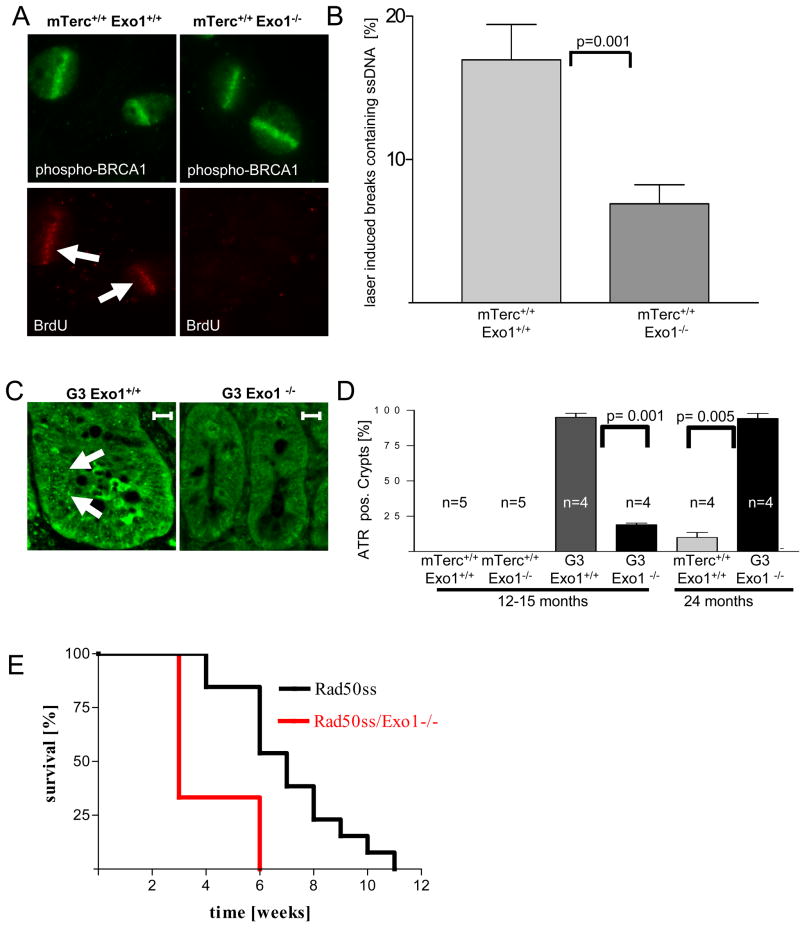
Exonuclease-1 (EXO1) mediates checkpoint induction in response to telomere dysfunction in yeast, but it is unknown whether EXO1 has similar functions in mammalian cells. Here we show that deletion of the nuclease domain of Exo1 reduces accumulation of DNA damage and DNA damage signal induction in telomere-dysfunctional mice. Exo1 deletion improved organ maintenance and lifespan of telomere-dysfunctional mice but did not increase chromosomal instability or cancer formation. Deletion of Exo1 also ameliorated the induction of DNA damage checkpoints in response to gamma-irradiation and conferred cellular resistance to 6-thioguanine-induced DNA damage. Exo1 deletion impaired upstream induction of DNA damage responses by reducing ssDNA formation and the recruitment of Replication Protein A (RPA) and ATR at DNA breaks. Together, these studies provide evidence that EXO1 contributes to DNA damage signal induction in mammalian cells, and deletion of Exo1 can prolong survival in the context of telomere dysfunction.


Figures

Figure 1
Figure 1
Exo1 deletion prolongs the lifespan and improves maintenance of intestinal epithelia in aging telomere dysfunctional mice. A) Survival curves for mTerc+/+, Exo1+/+ (n=89), mTerc+/+, Exo1−/− (n=27), G3, Exo1+/+ (n=25), and G3, Exo1−/− mice (n=34). Note that G3, Exo1−/− mice show a significantly prolonged lifespan compared to G3, Exo1+/+ (p<0.0001). B) Tumor free survival curves for the indicated mouse cohorts. There was a mild increase in tumor formation in G3mTerc−/−, Exo1+/+ mice compared to mTerc+/+, Exo1+/+ mice (p=0.03). Exo1 deletion did not accelerate tumor formation in G3mTerc−/−, Exo1−/− mice. C) Representative photographs of whole mount staining of the colon of 12–15 month old mice of the indicated genotypes (magnification bar: 500μm). D) Histogram on the number of crypts per low power vision field (35x) in the colon of 12–15 and 24 month old mice of the indicated genotypes. The number of crypts was counted on whole mount staining (n=4−6 mice per group). E) Representative photographs of H&E stained longitudinal sections of the small intestine of 12–15 month old mice of the indicated genotypes (magnification bar: 200μm). F) Histogram on the number of basal crypts per vision field (100x) in the small intestine of 12–15 and 24 month old mice of the indicated genotypes (n=4−5 mice per group). Note that Exo1 deletion rescues the depletion of colon crypts and basal crypts in small intestine of 12–15 month old G3 mTerc mice, but these phenotypes appear in 20–24 month old G3mTerc−/−, Exo1−/− mice.
Figure 2
Figure 2. Exo1 deletion rescues lymophopoiesis in aging telomere dysfunctional mice
A) Representative photographs of H&E stained longitudinal sections of the spleen of 12–15 month old mice of the indicated genotypes (magnification bar: 500μm). The lymphocyte containing white pulp is circled. B) Histogram on the frequency of B-lymphocytes in spleen of 12–15 and 24 month old mice of the indicated genotypes (n=4−6 mice/group). C) Histogram showing the total number of B-lymphocytes (B220+) and T-lymphocytes (CD8+ or CD4+) in total bone marrow (collected from 2 hind legs) of 12–15 month and 24 month old mice of the indicated genotypes (n=4–8 mice/group). D) FACS plot showing B-lymphocytes (B220+) in bone marrow of 12–15 month old mice of the indicated genotypes. E) Histogram showing the total number of thymocytes of 12–15 month old mice of the indicated genotypes (n=5). Note that the loss of thymocytes in G3, Exo1+/+ is rescued in G3, Exo1−/− mice. F) Representative FACS plots showing T- cell development in thymus of 12–15 month old mice of the indicated genotypes. Note that the percentage of CD8+, CD4+ double positive T-cells (immature T-cells) is reduced in G3, Exo1+/+ but rescued in G3, Exo1−/− mice.
Figure 3
Figure 3. Exo1 deletion increases cell proliferation and prevents apoptosis in telomere dysfunctional mice. A,B) Mice were pulsed with BrdU for 4 hours before sacrificing
A) Representative photographs of BrdU-stained crypts in the small intestine of 12–15 month old mice of the indicated genotypes. B) Histogram showing the percentage of BrdU and PCNA-negative crypts in the small intestine of 12–15 and 24 month old mice of the indicated genotypes (n=4–5 mice/group). C) Representative photographs of apoptotic cells (green nuclei) in basal crypts (circled) of the small intestine of 12–15 month old mice of the indicated genotypes. D) Histogram showing the number of TUNEL-positive nuclei per basal crypts in the small intestine of 12–15 and 24 month old mice of the indicated genotypes (n=4–5 mice/group).
Figure 4
Figure 4. Exo1 deletion does not rescue telomere function in G3 mTerc−/− mice
A) Telomere length was analyzed by qFISH in basal crypts of the small intestine of 12–15 month old mice (n=4/group) of the indicated genotypes. The histograms show the distribution of telomere fluorescence intensities (TFI) over all analyzed nuclei ofmTerc+/+, Exo1+/+ (n= 276 nuclei), mTerc+/+, Exo1−/− (n=160 nuclei), G3, Exo1+/+ (n=242 nuclei) and G3, Exo1−/− mice (n=263 nuclei). The red dotted lines indicate the mean value of each genotype. The black line marks the threshold of critically short telomeres (TFI <200 arbitrary units). B) Histogram on the rate of telomere-free ends per metaphase in bone marrow cells of 12–15 month old mice of the indicated genotypes (n=4–5). C) Representative photographs of a metaphase of a G3, Exo1−/− mouse, white arrows pointing on telomere-free ends (magnification bar: 4 pm). D) Histogram on the rate of anaphase bridges per total number of anaphases in basal crypts of small intestine of 12–15 month old mice of the indicated genotypes. E) Representative photograph showing an anaphase bridge in basal crypts of small intestine. F) Representative photograph showing SKY-analysis of metaphase spreads from bone marrow of 24 month old G3mTerc−/−, Exo1−/− mice. No aberrations were detected in 40 metaphases from G3, Exo1−/−mice (n=4).
Figure 5
Figure 5. Exo1 deletion prevents accumulation of DNA-damage and reduces DNA damage signaling in telomere dysfunctional mice
A) Representative photographs showing γ-H2AX positive cells (white arrows) in basal crypts of 12–15 month old mice of the indicated genotypes. Magnification bars 50μm. The inlet shows a nucleus containing γ-H2AX foci at high power magnification. B) Histogram showing the percentage of γ-H2AX positive basal crypts in 12–15 and 24 month old mice of the indicated genotypes (n= 4–5 mice/group). C) Representative photographs showing 53BP1 foci (white arrows) in basal crypts of 12–15 month old mice of the indicated genotypes. Magnification bars 50μm. The inlet shows a nucleus containing 53BP1 foci at high power magnification. D) Histogram showing the number of 53BP1 foci per basal crypts in 12–15 and 24 month old mice of the indicated genotypes (n= 4–5 mice/group). E) Representative photographs showing p53 positive cells (white arrows) in basal crypts of 12–15 month old mice of the indicated genotypes. Magnification bars 200 pm. F) Histogram showing the percentage of p53 positive basal crypts in 12–15 and 24 month old mice of the indicated genotypes (n= 4–5 mice/group). G) Representative photographs showing p21-positive nuclei (red arrows) in basal crypts of 12–15 month old mice of the indicated genotypes. Magnification bars 200 μm. H) Histogram showing the percentage of p21-positive intestinal basal crypts of 12–15 and 24 month old mice of the indicated genotypes (n=4–5 mice/group).
Figure 6
Figure 6. Exo1 deletion impairs DNA damage signal induction and confers resistance to DNA damaging agents
A) Representative photographs of BrdU-positive cells or TUNNEL positive cells in the intestinal basal crypts of 4 month old mice of the indicated genotypes: 24 hours after 4Gy γ-irradiation (IR). Magnification bars: 200 μm. B,C) Histogram showing the number of BrdU-positive cells per crypt (B) or TUNNEL positive cells per crypt (C) in the small intestine of 4 month old irradiated (IR) mice of the indicated genotypes (n=5 mice/group). D) Histogram showing the relative reduction of BrdU positive cells in 15Gy irradiated (24 hours after IR) compared to non- irradiated cells of the indicated genotypes. E) Histogram showing the relative increase in cells in G1 stage of cell cycle in 15Gy irradiated (24 hours after IR) compared to non- irradiated cells of the indicated genotypes. F) Survival curve of mouse embryonic stem cells of the indicated genotypes at 3–4 days after 6TG treatment at indicated doses. Survival curves for Exo1−/− (complete gene knockout) and Exo1exonΔ−/− (knockout of the nuclease domain, which was used throughout this study) were generated in two separate experiments. The survival curves for Msh2−/− and WT are the averaged survival curves from two separate experiments. G) Histogram showing the number γH2AX foci per nuclei in the small intestine of 4 month old mice (n=5 per group) of the indicated genotypes: 24 hours after 4Gy γ-irradiation (IR). H) Histogram showing the number of 53BP1 foci per crypt in the small intestine of 4 month old mice (n=5 per group) of the indicated genotypes: 24 hours after 4Gy γ-irradiation (IR). I) Western blots showing expression of phosphorylated ATR (Ser345), phosphorylated Chk2 (T68), and phosphorylated p53 (Ser15) along with β-actin as a loading control in mouse ear fibroblasts of the indicated genotypes at 24hrs after 15Gy irradiation and in non-irradiated controls.
Figure 7
Figure 7. Exo1 deletion impairs formation of ssDNA at laser induced DNA breaks in MEFs and the formation of ATR-foci in telomere dysfunctional mice
A) Representative photograph showing co-localization of ssDNA (stained by non-denaturing BrdU staining) and laser induced DNA breaks (stained by a phospho-BRCA1-antibody) in mTerc+/+, Exo1+/+ MEFs, but absence of such co-localization in mTerc+/+, Exo1−/− MEFs. B) Histogram showing the percentage of laser-induced DNA breaks (phospho-BRCA1) staining positive for ssDNA (non-denaturing BrdU) in MEFs of the indicated genotypes. C) Representative photograph showing γH2AX-formation and recruitment of RPA to laser induced DNA breaks in mTerc+/+, Exo1+/+ MEFs. Note that γH2AX-formation is independent of the Exo1-genotype but recruitment of RPA is reduced in mTerc+/+, Exo1−/− MEFs. D) Histogram showing the percentage of laser-induced DNA breaks staining positive for RPA in MEFs of the indicated genotypes. E) Representative photographs showing ATR-foci in nuclei of cells in basal crypts of 12–15 month old mice of the indicated genotypes (magnification bar 50 μm). F) Histogram showing the percentage of ATR positive basal crypts in 12–15 and 24 month old mice of the indicated genotypes (n= 4–5 mice/group).

References

    1. Allsopp RC, Vaziri H, Patterson C, Goldstein S, Younglai EV, Futcher AB, Greider CW, Harley CB. Telomere length predicts replicative capacity of human fibroblasts. Proc Natl Acad Sci U S A. 1992;89:10114–10118. - PMC - PubMed
    1. Armanios MY, Chen JJ, Cogan JD, Alder JK, Ingersoll RG, Markin C, Lawson WE, Xie M, Vulto I, Phillips JA, 3rd, et al. Telomerase mutations in families with idiopathic pulmonary fibrosis. N Engl J Med. 2007;356:1317–1326. - PubMed
    1. Artandi SE, Chang S, Lee SL, Alson S, Gottlieb GJ, Chin L, DePinho RA. Telomere dysfunction promotes non-reciprocal translocations and epithelial cancers in mice. Nature. 2000;406:641–645. - PubMed
    1. Ball SE, Gibson FM, Rizzo S, Tooze JA, Marsh JC, Gordon-Smith EC. Progressive telomere shortening in aplastic anemia. Blood. 1998;91:3582–3592. - PubMed
    1. Blackburn EH. Switching and signaling at the telomere. Cell. 2001;106:661–673. - PubMed

Publication types

MeSH terms