Delineating white matter structure in diffusion tensor MRI with anisotropy creases
- PMID: 17804278
- PMCID: PMC2367700
- DOI: 10.1016/j.media.2007.07.005
Delineating white matter structure in diffusion tensor MRI with anisotropy creases
Abstract
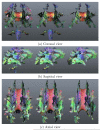
Geometric models of white matter architecture play an increasing role in neuroscientific applications of diffusion tensor imaging, and the most popular method for building them is fiber tractography. For some analysis tasks, however, a compelling alternative may be found in the first and second derivatives of diffusion anisotropy. We extend to tensor fields the notion from classical computer vision of ridges and valleys, and define anisotropy creases as features of locally extremal tensor anisotropy. Mathematically, these are the loci where the gradient of anisotropy is orthogonal to one or more eigenvectors of its Hessian. We propose that anisotropy creases provide a basis for extracting a skeleton of the major white matter pathways, in that ridges of anisotropy coincide with interiors of fiber tracts, and valleys of anisotropy coincide with the interfaces between adjacent but distinctly oriented tracts. The crease extraction algorithm we present generates high-quality polygonal models of crease surfaces, which are further simplified by connected-component analysis. We demonstrate anisotropy creases on measured diffusion MRI data, and visualize them in combination with tractography to confirm their anatomic relevance.
Figures


References
-
- Aldroubi A, Basser P. Reconstruction of vector and tensor fields from sampled discrete data. Contemporary Mathematics. 1999;247:1–15.
-
- Alexander A, Hasan K, Lazar M, Tsuruda J, Parker D. Analysis of partial volume effects in diffusion-tensor MRI. Magnetic Resonance in Medicine. 2001;45:770–780. - PubMed
-
- Alexander D, Barker G, Arridge S. Detection and modeling of non-gaussian apparent diffusion coefficients profiles in human brain data. Magnetic Resonance in Medicine. 2002;48:331–340. - PubMed
-
- Arsigny V, Fillard P, Pennec X, Ayache N. Log-Euclidean metrics for fast and simple calculus on diffusion tensors. Magnetic Resonance in Medicine. 2006 August;56(2):411–421. - PubMed
-
- Basser P. Inferring microstructural features and the physiological state of tissues from diffusion-weighted images. Nuclear Magnetic Resonance in Biomedicine. 1995;8:333–344. - PubMed
Publication types
MeSH terms
Grants and funding
- R01-MH074794/MH/NIMH NIH HHS/United States
- P41-RR13218/RR/NCRR NIH HHS/United States
- R01 MH050740/MH/NIMH NIH HHS/United States
- P41 RR015241/RR/NCRR NIH HHS/United States
- P41-RR15241-01A1/RR/NCRR NIH HHS/United States
- R01-AG20012-01/AG/NIA NIH HHS/United States
- R01-MH050740/MH/NIMH NIH HHS/United States
- U41 RR019703/RR/NCRR NIH HHS/United States
- R01 AG020012/AG/NIA NIH HHS/United States
- T32 EB002177/EB/NIBIB NIH HHS/United States
- P41 RR013218/RR/NCRR NIH HHS/United States
- P41 RR012553/RR/NCRR NIH HHS/United States
- R01 MH074794/MH/NIMH NIH HHS/United States
- P41-RR12553-07/RR/NCRR NIH HHS/United States
- T32-EB002177/EB/NIBIB NIH HHS/United States
LinkOut - more resources
Full Text Sources

