. 2007 Sep 5;27(36):9670-81.
doi: 10.1523/JNEUROSCI.2189-07.2007.

Fate-mapping the mammalian hindbrain: segmental origins of vestibular projection neurons assessed using rhombomere-specific Hoxa2 enhancer elements in the mouse embryo

Affiliations

Fate-mapping the mammalian hindbrain: segmental origins of vestibular projection neurons assessed using rhombomere-specific Hoxa2 enhancer elements in the mouse embryo

Massimo Pasqualetti et al. J Neurosci. .

Abstract

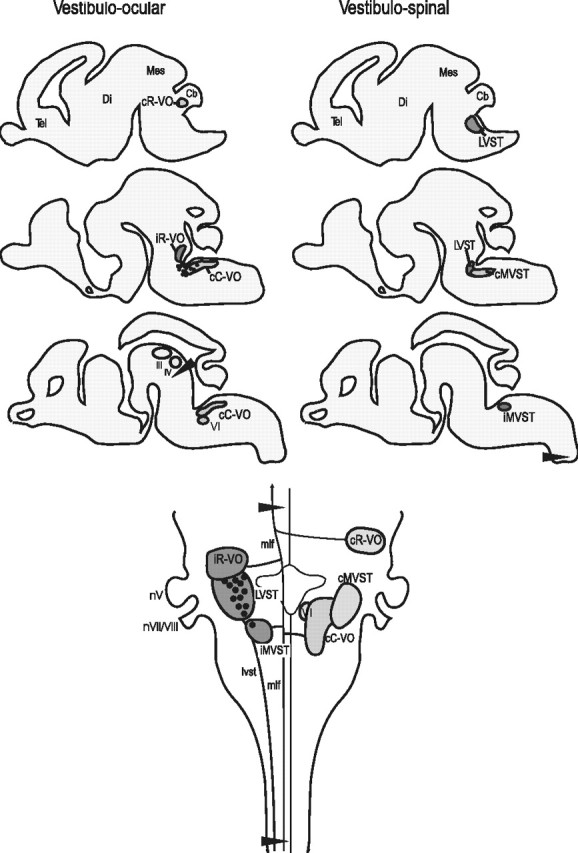
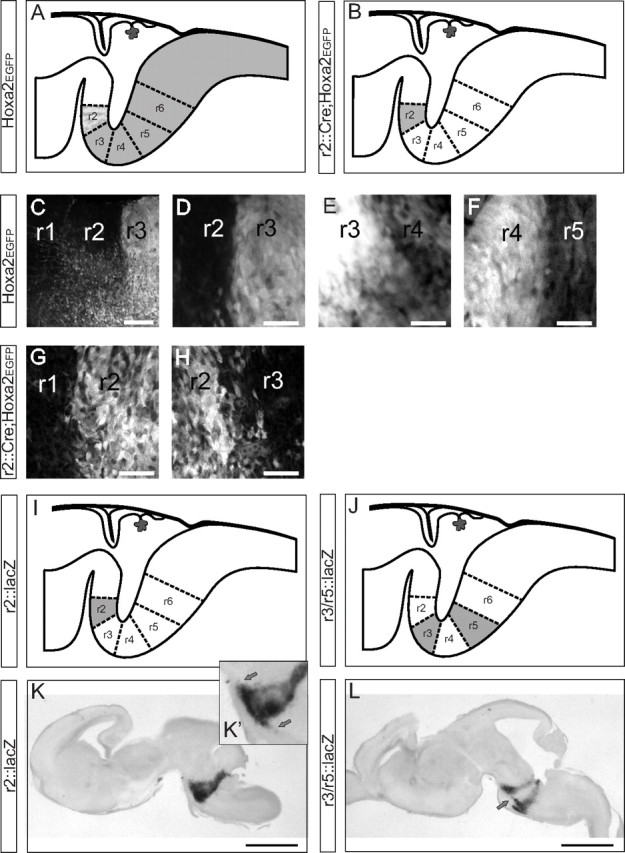
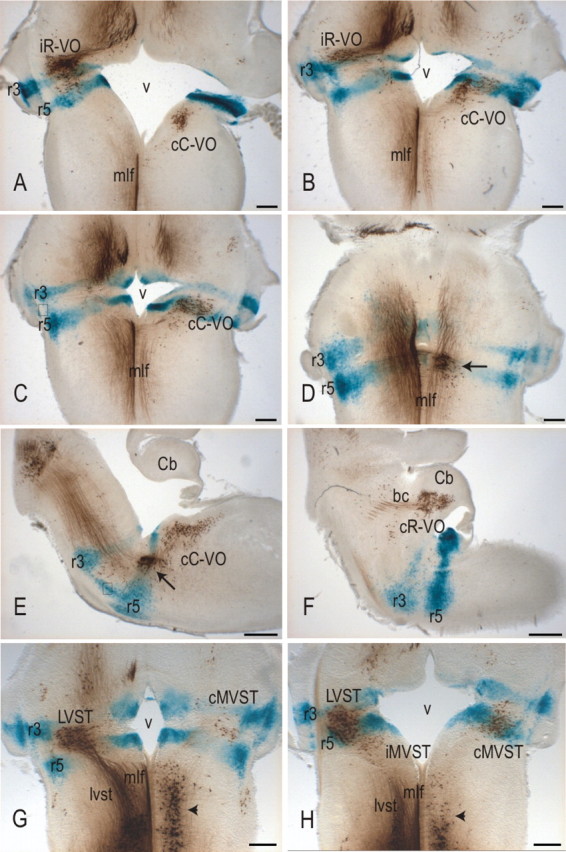
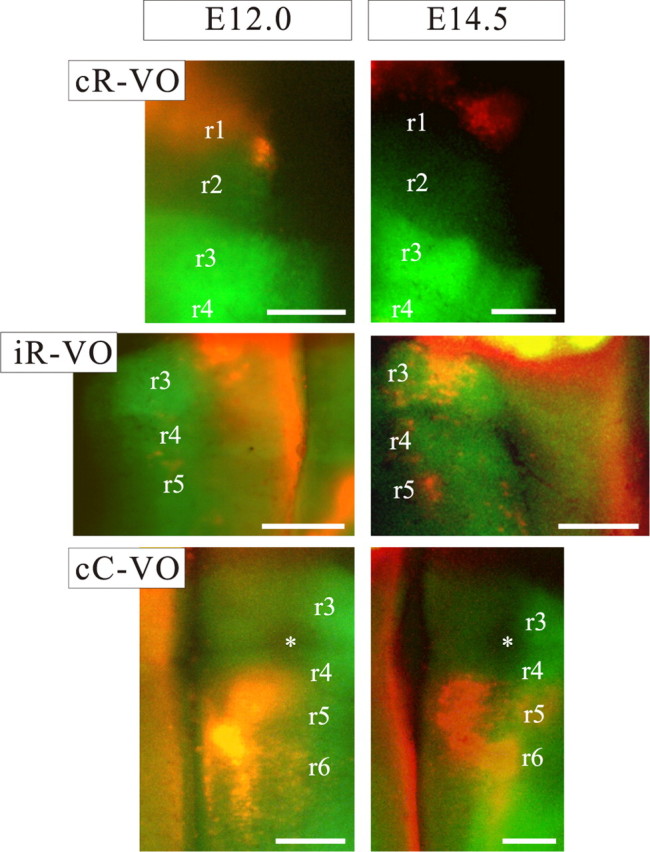
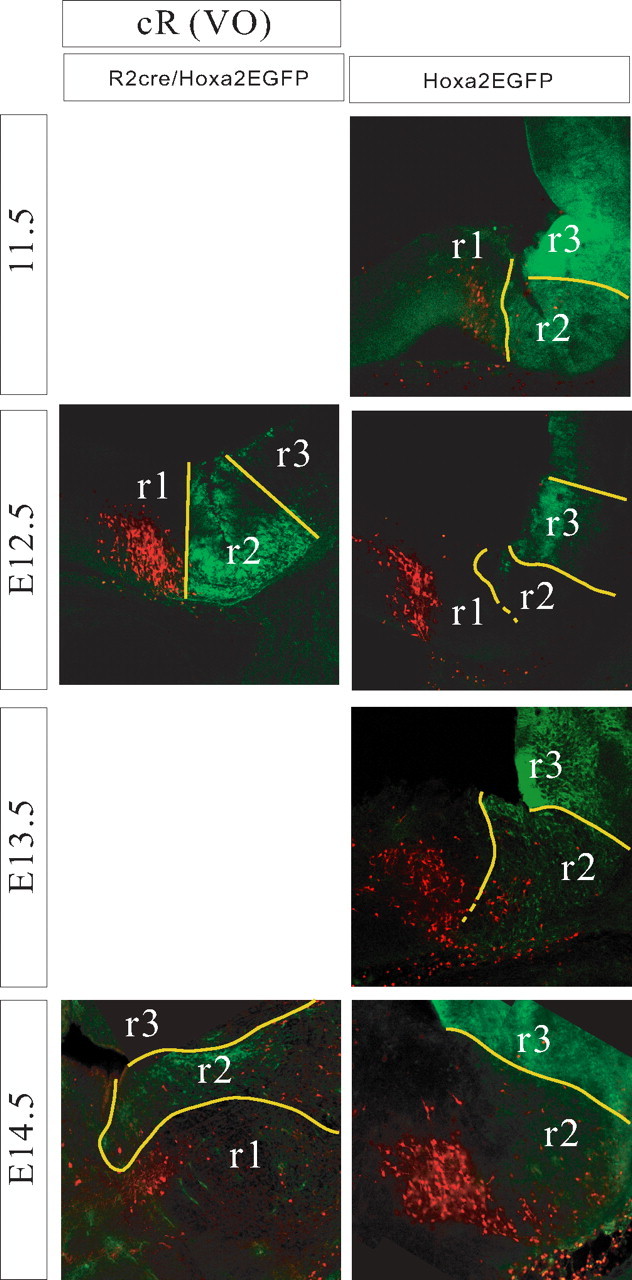
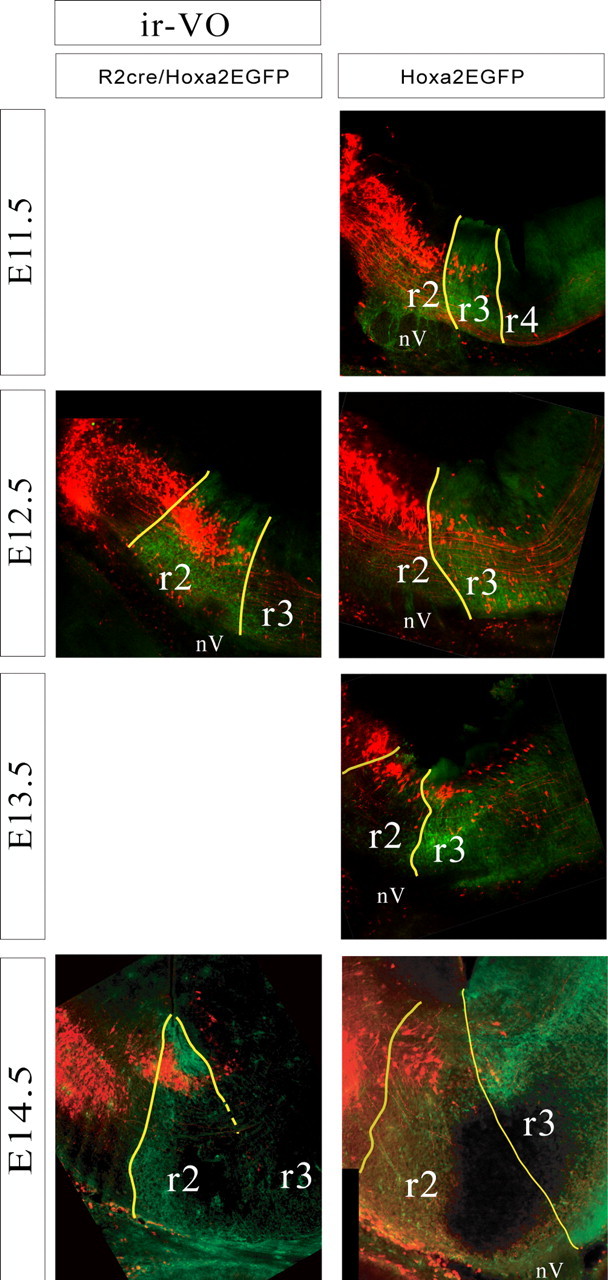
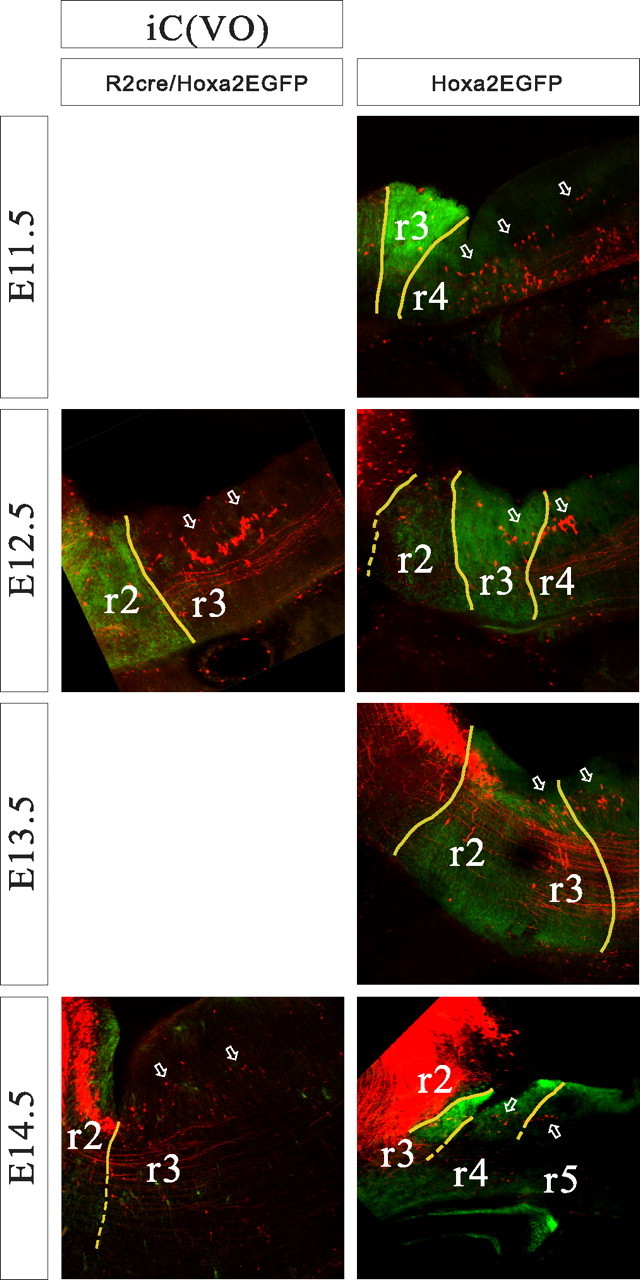
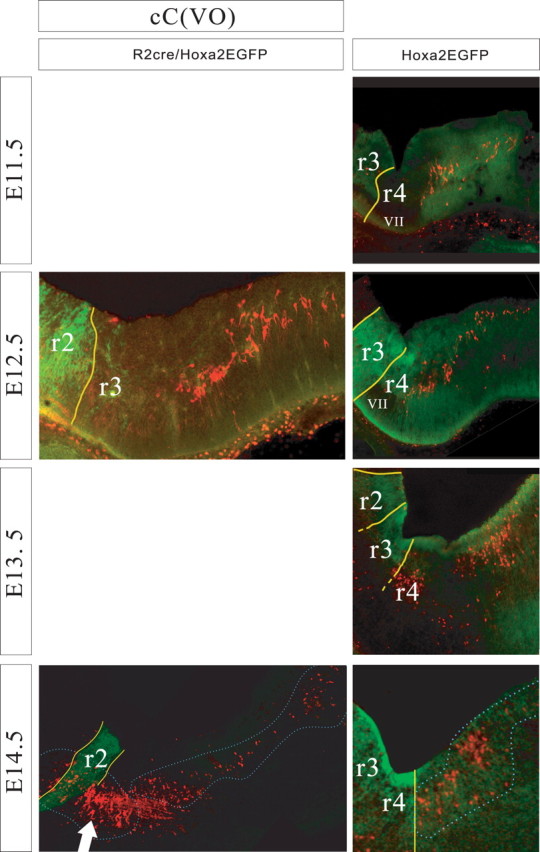
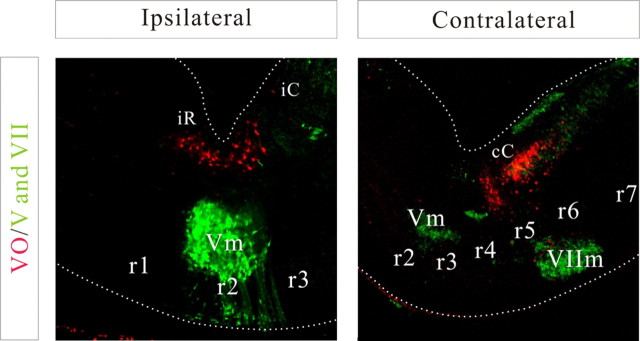
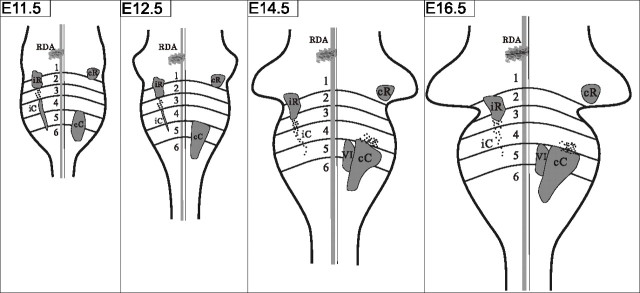
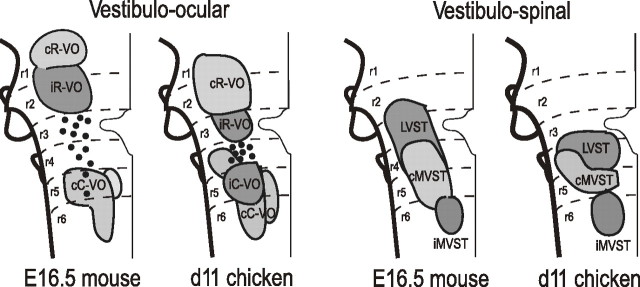
As a step toward generating a fate map of identified neuron populations in the mammalian hindbrain, we assessed the contributions of individual rhombomeres to the vestibular nuclear complex, a major sensorimotor area that spans the entire rhombencephalon. Transgenic mice harboring either the lacZ or the enhanced green fluorescent protein reporter genes under the transcriptional control of rhombomere-specific Hoxa2 enhancer elements were used to visualize rhombomere-derived domains. We labeled functionally identifiable vestibular projection neuron groups retrogradely with conjugated dextran-amines at successive embryonic stages and obtained developmental fate maps through direct comparison with the rhombomere-derived domains in the same embryos. The fate maps show that each vestibular neuron group derives from a unique rostrocaudal domain that is relatively stable developmentally, suggesting that anteroposterior migration is not a major contributor to the rostrocaudal patterning of the vestibular system. Most of the groups are multisegmental in origin, and each rhombomere is fated to give rise to two or more vestibular projection neuron types, in a complex pattern that is not segmentally iterated. Comparison with studies in the chicken embryo shows that the rostrocaudal patterning of identified vestibular projection neuron groups is generally well conserved between avians and mammalians but that significant species-specific differences exist in the rostrocaudal limits of particular groups. This mammalian hindbrain fate map can be used as the basis for targeting genetic manipulation to specific subpopulations of vestibular projection neurons.


Figures

Figure 1.
Figure 1.
Top, Application sites (arrowheads) for dextran-amine labeling of vestibulo-ocular (left) and vestibulospinal (right) neuron groups and the domains of these groups as seen in serial parasagittal sections (lateral to medial = top to bottom) of the entire brain at E16.5. Ipsilaterally projecting groups are in dark gray, and contralaterally projecting groups are in light gray. Bottom, The domains of the groups as seen from the dorsal surface of the E16.5 hindbrain. Ipsilaterally projecting groups are on the left side, and contralaterally projecting are on the right side. Arrowheads indicate dextran-amine application sites. Tel, Telencephalon; Di, diencephalon; Mes, mesencephalon; Cb, cerebellum; nV, trigeminal nerve entry zone.
Figure 2.
Figure 2.
Changes in reporter gene expression along the rostrocaudal axis can be used to define rhombomere-derived territories. A–H, Schematic summaries and confocal images of rhombomere boundaries in the Hoxa2EGFP and r2::Cre;Hoxa2EGFP(lox-neo-lox) reporter mice in parasagittal sections at E12.5. Note that brightness and contrast may vary from panel to panel in C–H to highlight the domain with the highest expression. I–L, Schematic summaries and images of β-galactosidase expression domains in the r2::lacZ and r3/r5::lacZ reporter mice seen in parasagittal vibratome sections at E16.5 (the only stage at which these mice were used). Note longitudinal streams of migrating cells in the ventral region extending from r2 into r1 and r3 in the r2::lacZ mouse (K′, inset, arrows) and between r3 and r5 in the r3/r5::lacZ mouse (arrow). Examples of expression boundaries (and additional migratory streams in more dorsal regions) in the r3/r5::lacZ mouse can also be seen in horizontal sections in Figure 3. Scale bars: C, 100 μm; D–H, 60 μm; K, L, 1 mm.
Figure 3.
Figure 3.
The relationship between rhombomere-derived territories and the domains of the vestibulo-ocular and vestibulospinal groups in horizontal sections at E16.5, assessed by retrograde labeling with BDA in the r3/r5::lacZ mouse. bc, Brachium conjunctivum; Cb, cerebellum; v, fourth ventricle. Arrows in D and E indicate the subpopulation of cC-VO neurons located in the abducens nucleus. Boxes in C and E indicate migratory cell streams between r3 and r5. Arrowheads in G and H indicate reticulospinal neurons that are also labeled by the spinal BDA application site used to label vestibulospinal neurons. Scale bars: A–D, G, H, 200 μm; E, F, 400 μm.
Figure 4.
Figure 4.
The relationship between rhombomeric territories (r1–r6) and the domains of the vestibulo-ocular groups at E12.0 and E14.5 as seen in whole-mount preparations of the Hoxa2EGFP mouse. Medial is to the left for the cR-VO and cC-VO groups and to the right for the iR-VO group. Some of the rhombomere boundaries can be seen clearly at these stages, independently of the EGFP expression pattern. Note that overlaps between the neuron groups and the EGFP expression domains can only be definitively assessed in sections (see Figs. 5–8). Asterisks mark the trigeminal nerve root, where EGFP expression is absent. Scale bars, 200 μm.
Figure 5.
Figure 5.
Relationship of the cR-VO group to rhombomere-derived domains as seen in parasagittal sections of r2::Cre;Hoxa2EGFP(lox–neo–lox) mice (left) and Hoxa2EGFP mice (right) at E11.5–E14.5. Yellow lines indicate expression domain boundaries that were clearly visible, and broken lines indicate less certain boundaries. Dorsal is up, and rostral is to the left.
Figure 6.
Figure 6.
Relationship of the iR-VO group to rhombomere-derived domains as seen in parasagittal sections of r2::Cre;Hoxa2EGFP(lox–neo–lox) mice (left) and Hoxa2EGFP mice (right) at E11.5–E14.5. Yellow lines indicate expression domain boundaries that were clearly visible, and broken lines indicate less certain boundaries. Dorsal is up, and rostral is to the left. nV, Trigeminal nerve entry zone, which is devoid of EGFP expression.
Figure 7.
Figure 7.
Relationship of the iC-VO group to rhombomere-derived domains as seen in parasagittal sections of r2::Cre;Hoxa2EGFP(lox–neo–lox) mice (left) and Hoxa2EGFP mice (right) at E11.5–E14.5. Arrows indicate the iC-VO neurons, which are few in number and dwindle markedly by E14.5. Yellow lines indicate expression domain boundaries that were clearly visible, and broken lines indicate less certain boundaries. Dorsal is up, and rostral is to the left.
Figure 8.
Figure 8.
Relationship of the cC-VO group to rhombomere-derived domains as seen in parasagittal sections of r2::Cre;Hoxa2EGFP(lox–neo–lox) mice (left) and Hoxa2EGFP mice (right) at E11.5–E14.5. Yellow lines indicate expression domain boundaries that were clearly visible, and broken lines indicate less certain boundaries. Dorsal is up, and rostral is to the left. nVII, Facial nerve entry zone, which is devoid of EGFP expression. At E14.5, the cC-VO group is outlined. In the r2::Cre;Hoxa2EGFP(lox–neo–lox) panel (left), the large arrow indicates a population of labeled neurons, probably rostrally projecting raphe neurons, located ventral to the domains that contain the vestibular projection neuron populations.
Figure 9.
Figure 9.
Relationship of the three vestibulo-ocular projection neuron groups [iR-VO (iR), iC-VO (iC), and cC-VO (cC); labeled red] to the trigeminal (Vm) and facial (VIIm) cranial motor nuclei (labeled green) at E14.5. Approximate locations of the rhombomere domains are indicated.
Figure 10.
Figure 10.
Developmental summary of vestibular projection neuron group domains.
Figure 11.
Figure 11.
Comparison of vestibular projection neuron fate maps in the chicken and mouse embryos. The chicken fate map is as reported by Díaz et al. (1998).

References

    1. Altman J, Bayer SA. Development of the brain stem in the rat. III. Thymidine-radiographic study of the time of origin of neurons of the vestibular and auditory nuclei of the upper medulla. J Comp Neurol. 1980;194:877–904. - PubMed
    1. Anderson SA, Marin O, Horn C, Jennings K, Rubenstein JL. Distinct cortical migrations from the medial and lateral ganglionic eminences. Development. 2001;128:353–363. - PubMed
    1. Auclair F, Marchand R, Glover JC. Regional patterning of reticulospinal and vestibulospinal neurons in the hindbrain of rat and mouse embryos. J Comp Neurol. 1999;411:288–300. - PubMed
    1. Baader SL, Schilling ML, Rosengarten B, Pretsch W, Teutsch HF, Oberdick J, Schilling K. Purkinje cell lineage and the topographic organization of the cerebellar cortex: a view from X inactivation mosaics. Dev Biol. 1996;174:393–406. - PubMed
    1. Baker R, Highstein SM. Physiological identification of interneurons and motoneurons in the abducens nucleus. Brain Res. 1975;91:292–298. - PubMed

Publication types

LinkOut - more resources