

An energy budget for the olfactory glomerulus
- PMID: 17804639
- PMCID: PMC6672954
- DOI: 10.1523/JNEUROSCI.1415-07.2007
An energy budget for the olfactory glomerulus
Abstract
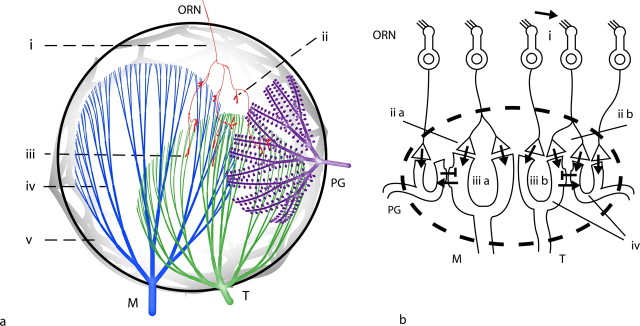
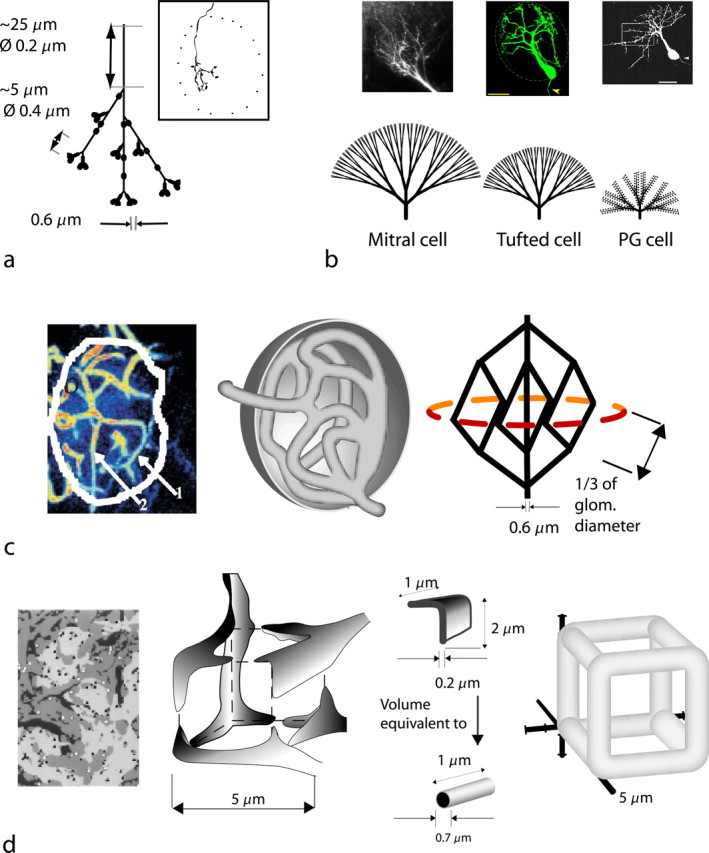
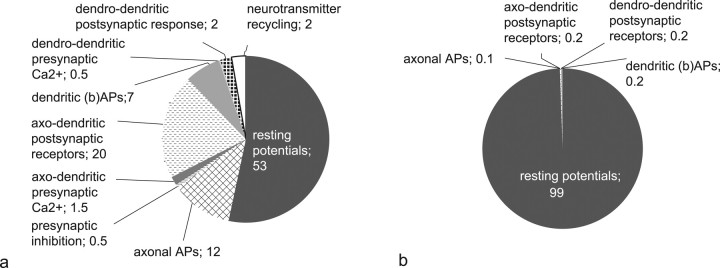
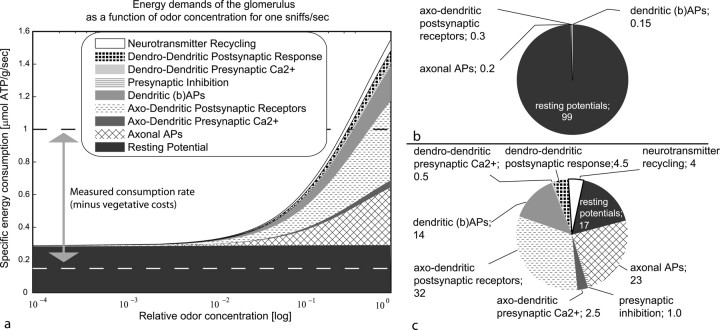
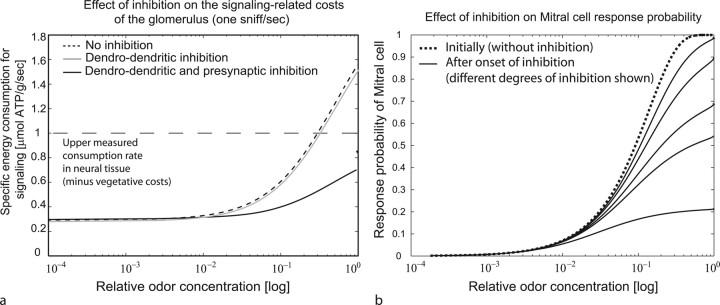
Energy demands are becoming recognized as an important constraint on neural signaling. The olfactory glomerulus provides a well defined system for analyzing this question. Odor stimulation elicits high-energy demands in olfactory glomeruli where olfactory axons converge onto dendrites of olfactory bulb neurons. We performed a quantitative analysis of the energy demands of each type of neuronal element within the glomerulus. This included the volumes of each element, their surface areas, and ion loads associated with membrane potentials and synaptic activation as constrained by experimental observations. In the resting state, there was a high-energy demand compared with other brain regions because of the high density of neural elements. The activated state was dominated by the energy demands of action potential propagation in afferent olfactory sensory neurons and their synaptic input to dendritic tufts, whereas subsequent dendritic potentials and dendrodendritic transmission contributed only a minor share of costs. It is proposed therefore that afferent input and axodendritic transmission account for the strong signals registered by 2-deoxyglucose and functional magnetic resonance imaging, although postsynaptic dendrites comprise at least one-half of the volume of the glomerulus. The results further suggest that presynaptic inhibition of the axon terminals by periglomerular cells plays an important role in limiting the range of excitation of the postsynaptic cells. These results provide a new quantitative basis for interpreting olfactory bulb activation patterns elicited by odor stimulation.
Figures
Similar articles
-
Tonic and synaptically evoked presynaptic inhibition of sensory input to the rat olfactory bulb via GABA(B) heteroreceptors.J Neurophysiol. 2000 Sep;84(3):1194-203. doi: 10.1152/jn.2000.84.3.1194. J Neurophysiol. 2000. PMID: 10979995
-
Compartmental organization of the olfactory bulb glomerulus.J Comp Neurol. 1999 May 3;407(2):261-74. J Comp Neurol. 1999. PMID: 10213094
-
Metabotropic glutamate receptors promote disinhibition of olfactory bulb glomeruli that scales with input strength.J Neurophysiol. 2015 Mar 15;113(6):1907-20. doi: 10.1152/jn.00222.2014. Epub 2014 Dec 31. J Neurophysiol. 2015. PMID: 25552635 Free PMC article.
-
synaptic organization of the glomerulus in the main olfactory bulb: compartments of the glomerulus and heterogeneity of the periglomerular cells.Anat Sci Int. 2005 Jun;80(2):80-90. doi: 10.1111/j.1447-073x.2005.00092.x. Anat Sci Int. 2005. PMID: 15960313 Review.
-
Coding and synaptic processing of sensory information in the glomerular layer of the olfactory bulb.Semin Cell Dev Biol. 2006 Aug;17(4):411-23. doi: 10.1016/j.semcdb.2006.04.007. Epub 2006 May 5. Semin Cell Dev Biol. 2006. PMID: 16765614 Review.
Cited by
-
Serotonin circuits and anxiety: what can invertebrates teach us?Invert Neurosci. 2012 Dec;12(2):81-92. doi: 10.1007/s10158-012-0140-y. Epub 2012 Aug 24. Invert Neurosci. 2012. PMID: 22918570 Free PMC article. Review.
-
Average firing rate rather than temporal pattern determines metabolic cost of activity in thalamocortical relay neurons.Sci Rep. 2019 May 6;9(1):6940. doi: 10.1038/s41598-019-43460-8. Sci Rep. 2019. PMID: 31061521 Free PMC article.
-
Synaptic circuitry of identified neurons in the antennal lobe of Drosophila melanogaster.J Comp Neurol. 2016 Jun 15;524(9):1920-56. doi: 10.1002/cne.23966. Epub 2016 Mar 9. J Comp Neurol. 2016. PMID: 26780543 Free PMC article.
-
The olfactory bulb as the entry site for prion-like propagation in neurodegenerative diseases.Neurobiol Dis. 2018 Jan;109(Pt B):226-248. doi: 10.1016/j.nbd.2016.12.013. Epub 2016 Dec 20. Neurobiol Dis. 2018. PMID: 28011307 Free PMC article.
-
Deciphering neuron-glia compartmentalization in cortical energy metabolism.Front Neuroenergetics. 2009 Jul 9;1:4. doi: 10.3389/neuro.14.004.2009. eCollection 2009. Front Neuroenergetics. 2009. PMID: 19636395 Free PMC article.
References
-
- Abraham NM, Spors H, Carleton A, Margrie TW, Kuner T, Schaefer AT. Maintaining accuracy at the expense of speed: stimulus similarity defines odor discrimination time in mice. Neuron. 2004;44:865–876. - PubMed
-
- Ames A., III CNS energy metabolism as related to function. Brain Res Brain Res Rev. 2000;34:42–68. - PubMed
-
- Aroniadou-Anderjaska V, Zhou FM, Priest CA, Ennis M, Shipley MT. Tonic and synaptically evoked presynaptic inhibition of sensory input to the rat olfactory bulb via GABA(B) heteroreceptors. J Neurophysiol. 2000;84:1194–1203. - PubMed
-
- Attwell D, Iadecola C. The neural basis of functional brain imaging signals. Trends Neurosci. 2002;25:621–625. - PubMed
Publication types
MeSH terms
Substances
LinkOut - more resources
Full Text Sources
Other Literature Sources