

Real-time observations of single bacteriophage lambda DNA ejections in vitro
- PMID: 17804798
- PMCID: PMC1976217
- DOI: 10.1073/pnas.0703274104
Real-time observations of single bacteriophage lambda DNA ejections in vitro
Abstract
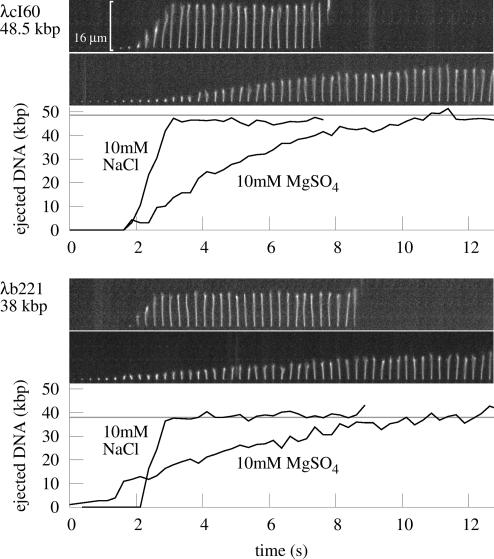
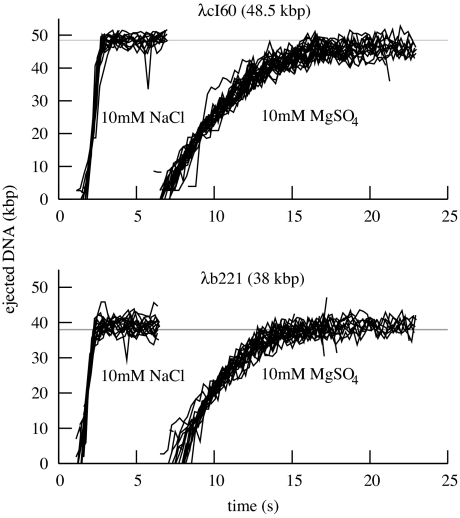
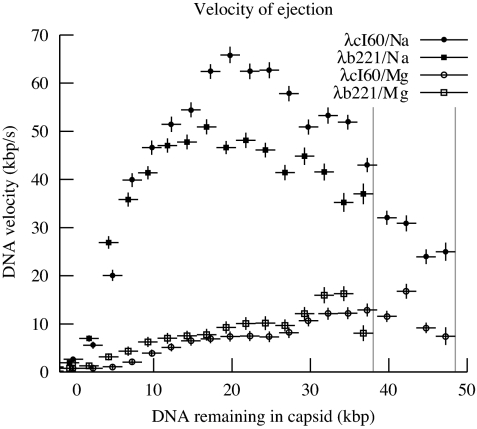
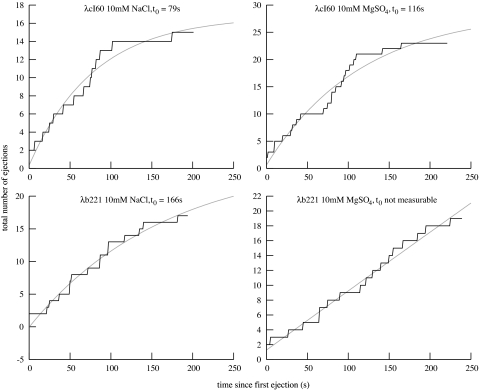
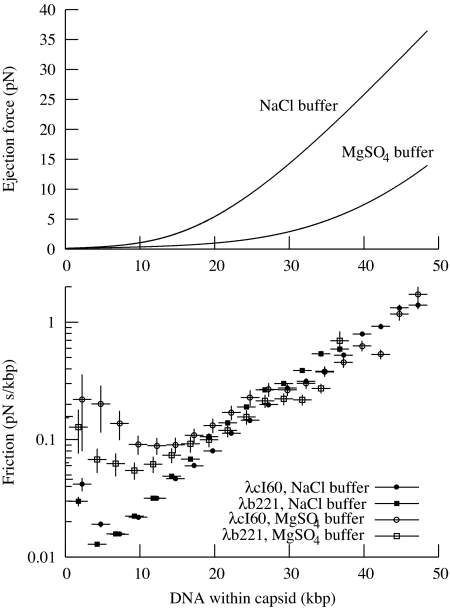
The physical, chemical, and structural features of bacteriophage genome release have been the subject of much recent attention. Many theoretical and experimental studies have centered on the internal forces driving the ejection process. Recently, Mangenot et al. [Mangenot S, Hochrein M, Rädler J, Letellier L (2005) Curr Biol 15:430-435.] reported fluorescence microscopy of phage T5 ejections, which proceeded stepwise between DNA nicks, reaching a translocation speed of 75 kbp/s or higher. It is still unknown how high the speed actually is. This paper reports real-time measurements of ejection from phage lambda, revealing how the speed depends on key physical parameters such as genome length and ionic state of the buffer. Except for a pause before DNA is finally released, the entire 48.5-kbp genome is translocated in approximately 1.5 s without interruption, reaching a speed of 60 kbp/s. The process gives insights particularly into the effects of two parameters: a shorter genome length results in lower speed but a shorter total time, and the presence of divalent magnesium ions (replacing sodium) reduces the pressure, increasing ejection time to 8-11 s. Pressure caused by DNA-DNA interactions within the head affects the initiation of ejection, but the close packing is also the dominant source of friction: more tightly packed phages initiate ejection earlier, but with a lower initial speed. The details of ejection revealed in this study are probably generic features of DNA translocation in bacteriophages and have implications for the dynamics of DNA in other biological systems.
Conflict of interest statement
The authors declare no conflict of interest.
Figures
Similar articles
-
A single-molecule Hershey-Chase experiment.Curr Biol. 2012 Jul 24;22(14):1339-43. doi: 10.1016/j.cub.2012.05.023. Epub 2012 Jun 21. Curr Biol. 2012. PMID: 22727695 Free PMC article.
-
The effect of genome length on ejection forces in bacteriophage lambda.Virology. 2006 May 10;348(2):430-6. doi: 10.1016/j.virol.2006.01.003. Epub 2006 Feb 15. Virology. 2006. PMID: 16469346 Free PMC article.
-
Dynamics of DNA ejection from bacteriophage.Biophys J. 2006 Jul 15;91(2):411-20. doi: 10.1529/biophysj.105.070532. Epub 2006 May 5. Biophys J. 2006. PMID: 16679360 Free PMC article.
-
Virus DNA packaging: the strategy used by phage lambda.Mol Microbiol. 1995 Jun;16(6):1075-86. doi: 10.1111/j.1365-2958.1995.tb02333.x. Mol Microbiol. 1995. PMID: 8577244 Review.
-
Bending and supercoiling of DNA at the attachment site of bacteriophage lambda.Trends Biochem Sci. 1990 Jun;15(6):222-7. doi: 10.1016/0968-0004(90)90034-9. Trends Biochem Sci. 1990. PMID: 2166364 Review.
Cited by
-
Capstan friction model for DNA ejection from bacteriophages.Phys Rev Lett. 2012 Dec 14;109(24):248105. doi: 10.1103/PhysRevLett.109.248105. Epub 2012 Dec 10. Phys Rev Lett. 2012. PMID: 23368388 Free PMC article.
-
OmpA and OmpC are critical host factors for bacteriophage Sf6 entry in Shigella.Mol Microbiol. 2014 Apr;92(1):47-60. doi: 10.1111/mmi.12536. Epub 2014 Mar 6. Mol Microbiol. 2014. PMID: 24673644 Free PMC article.
-
Laminar flow cells for single-molecule studies of DNA-protein interactions.Nat Methods. 2008 Jun;5(6):517-25. doi: 10.1038/nmeth.1217. Nat Methods. 2008. PMID: 18511919 Free PMC article.
-
Phage-like packing structures with mean field sequence dependence.J Comput Chem. 2017 Jun 5;38(15):1191-1197. doi: 10.1002/jcc.24727. Epub 2017 Mar 27. J Comput Chem. 2017. PMID: 28349552 Free PMC article.
-
Structural organization of DNA in chlorella viruses.PLoS One. 2012;7(2):e30133. doi: 10.1371/journal.pone.0030133. Epub 2012 Feb 16. PLoS One. 2012. PMID: 22359540 Free PMC article.
References
Publication types
MeSH terms
Substances
Grants and funding
LinkOut - more resources
Full Text Sources
Other Literature Sources
