

Magnetic microposts as an approach to apply forces to living cells
- PMID: 17804810
- PMCID: PMC1976246
- DOI: 10.1073/pnas.0611613104
Magnetic microposts as an approach to apply forces to living cells
Abstract
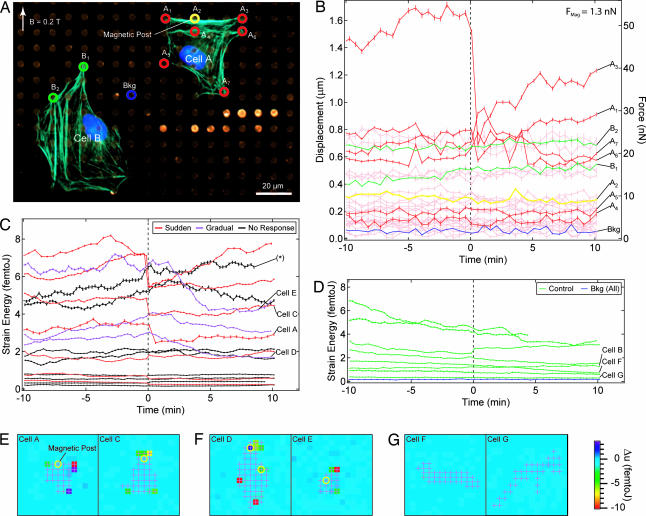
Cells respond to mechanical forces whether applied externally or generated internally via the cytoskeleton. To study the cellular response to forces separately, we applied external forces to cells via microfabricated magnetic posts containing cobalt nanowires interspersed among an array of elastomeric posts, which acted as independent sensors to cellular traction forces. A magnetic field induced torque in the nanowires, which deflected the magnetic posts and imparted force to individual adhesions of cells attached to the array. Using this system, we examined the cellular reaction to applied forces and found that applying a step force led to an increase in local focal adhesion size at the site of application but not at nearby nonmagnetic posts. Focal adhesion recruitment was enhanced further when cells were subjected to multiple force actuations within the same time interval. Recording the traction forces in response to such force stimulation revealed two responses: a sudden loss in contractility that occurred within the first minute of stimulation or a gradual decay in contractility over several minutes. For both types of responses, the subcellular distribution of loss in traction forces was not confined to locations near the actuated micropost, nor uniformly across the whole cell, but instead occurred at discrete locations along the cell periphery. Together, these data reveal an important dynamic biological relationship between external and internal forces and demonstrate the utility of this microfabricated system to explore this interaction.
Conflict of interest statement
The authors declare no conflict of interest.
Figures


Similar articles
-
Magnetic microposts for mechanical stimulation of biological cells: fabrication, characterization, and analysis.Rev Sci Instrum. 2008 Apr;79(4):044302. doi: 10.1063/1.2906228. Rev Sci Instrum. 2008. PMID: 18447536 Free PMC article.
-
Traction forces exerted by epithelial cell sheets.J Phys Condens Matter. 2010 May 19;22(19):194119. doi: 10.1088/0953-8984/22/19/194119. Epub 2010 Apr 26. J Phys Condens Matter. 2010. PMID: 21386442
-
A novel patterned magnetic micropillar array substrate for analysis of cellular mechanical responses.J Biomech. 2017 Dec 8;65:194-202. doi: 10.1016/j.jbiomech.2017.10.017. Epub 2017 Oct 25. J Biomech. 2017. PMID: 29126605
-
Mechanotransduction - a field pulling together?J Cell Sci. 2008 Oct 15;121(Pt 20):3285-92. doi: 10.1242/jcs.023507. J Cell Sci. 2008. PMID: 18843115 Review.
-
Life on the wire: on tensegrity and force balance in cells.Acta Biomed. 2005 Apr;76(1):5-12. Acta Biomed. 2005. PMID: 16116819 Review.
Cited by
-
Mechanobiology of platelets: techniques to study the role of fluid flow and platelet retraction forces at the micro- and nano-scale.Int J Mol Sci. 2011;12(12):9009-30. doi: 10.3390/ijms12129009. Epub 2011 Dec 7. Int J Mol Sci. 2011. PMID: 22272117 Free PMC article. Review.
-
Hydrogel platform capable of molecularly resolved pulling on cells for mechanotransduction.Mater Today Bio. 2022 Nov 4;17:100476. doi: 10.1016/j.mtbio.2022.100476. eCollection 2022 Dec 15. Mater Today Bio. 2022. PMID: 36407911 Free PMC article.
-
Live-cell subcellular measurement of cell stiffness using a microengineered stretchable micropost array membrane.Integr Biol (Camb). 2012 Oct;4(10):1289-98. doi: 10.1039/c2ib20134h. Integr Biol (Camb). 2012. PMID: 22935822 Free PMC article.
-
Wafer-scale synthesis of monodisperse synthetic magnetic multilayer nanorods.Nano Lett. 2014 Jan 8;14(1):333-8. doi: 10.1021/nl404089t. Epub 2013 Dec 17. Nano Lett. 2014. PMID: 24329003 Free PMC article.
-
Magnetic approaches to study collective three-dimensional cell mechanics in long-term cultures (invited).J Appl Phys. 2014 May 7;115(17):172616. doi: 10.1063/1.4870918. Epub 2014 Apr 15. J Appl Phys. 2014. PMID: 24803684 Free PMC article.
References
-
- Chen CS, Tan J, Tien J. Annu Rev Biomed Eng. 2004;6:275–302. - PubMed
-
- Davies PF, Barbee KA, Volin MV, Robotewskyj A, Chen J, Joseph L, Griem ML, Wernick MN, Jacobs E, Polacek DC, et al. Annu Rev Physiol. 1997;59:527–549. - PubMed
-
- McBeath R, Pirone DM, Nelson CM, Bhadriraju K, Chen CS. Dev Cell. 2004;6:483–495. - PubMed
Publication types
MeSH terms
Substances
LinkOut - more resources
Full Text Sources
Other Literature Sources
Molecular Biology Databases
