. 2007 Nov 1;584(Pt 3):835-51.
doi: 10.1113/jphysiol.2007.139683. Epub 2007 Sep 6.

Changes in synaptic transmission properties due to the expression of N-type calcium channels at the calyx of Held synapse of mice lacking P/Q-type calcium channels

Affiliations

Changes in synaptic transmission properties due to the expression of N-type calcium channels at the calyx of Held synapse of mice lacking P/Q-type calcium channels

Carlota González Inchauspe et al. J Physiol. .

Abstract

P/Q-type and N-type calcium channels mediate transmitter release at rapidly transmitting central synapses, but the reasons for the specific expression of one or the other in each particular synapse are not known. Using whole-cell patch clamping from in vitro slices of the auditory brainstem we have examined presynaptic calcium currents (I(pCa)) and glutamatergic excitatory postsynaptic currents (EPSCs) at the calyx of Held synapse from transgenic mice in which the alpha(1A) pore-forming subunit of the P/Q-type Ca(2+) channels is ablated (KO). The power relationship between Ca(2+) influx and quantal output was studied by varying the number of Ca(2+) channels engaged in triggering release. Our results have shown that more overlapping Ca(2+) channel domains are required to trigger exocytosis when N-type replace P/Q-type calcium channels suggesting that P/Q type Ca(2+) channels are more tightly coupled to synaptic vesicles than N-type channels, a hypothesis that is verified by the decrease in EPSC amplitudes in KO synapses when the slow Ca(2+) buffer EGTA-AM was introduced into presynaptic calyces. Significant alterations in short-term synaptic plasticity were observed. Repetitive stimulation at high frequency generates short-term depression (STD) of EPSCs, which is not caused by presynaptic Ca(2+) current inactivation neither in WT or KO synapses. Recovery after STD is much slower in the KO than in the WT mice. Synapses from KO mice exhibit reduced or no EPSC paired-pulse facilitation and absence of facilitation in their presynaptic N-type Ca(2+) currents. Simultaneous pre- and postsynaptic double patch recordings indicate that presynaptic Ca(2+) current facilitation is the main determinant of facilitation of transmitter release. Finally, KO synapses reveal a stronger modulation of transmitter release by presynaptic GTP-binding protein-coupled receptors (gamma-aminobutyric acid type B receptors, GABA(B), and adenosine). In contrast, metabotropic glutamate receptors (mGluRs) are not functional at the synapses of these mice. These experiments reinforce the idea that presynaptic Ca(2+) channels expression may be tuned for speed and modulatory control through differential subtype expression.


Figures
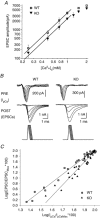
Figure 1
Figure 1
Calcium dependence of transmitter release at the calyx of Held synapse A, relationship between EPSC amplitude and external calcium concentration for WT and KO mice (note double logarithmic axes). EPSCs were evoked by trapezoid fibre stimulation and recorded under voltage clamp conditions at a holding potential of −70 mV. The line is the fit to a linear function showing that the amplitude of EPSC is proportional to the calcium concentration raised to a power of 2.14 ± 0.10 for WT (n = 14, R = 0.998) and 2.14 ± 0.14 for KO (n = 6, R = 0.996). B, double patch recordings from the calyx of Held presynaptic terminal and the principal MNTB neuron to assess the relationship between EPSC and IpCa upon variation of the number of Ca2+ channels engaged in triggering release. Recordings of presynaptic Ca2+ currents (PRE) and EPSCs (POST) in WT and P/Q KO mice, in response to presynaptic voltage protocols (lower traces) with action potential-like waveforms (ramps from −70 to +60 mV; rise and fall time 0.2 ms, plateau duration increasing from 0.1 to 0.7 ms in 0.1 ms increments). External solution contains 1 mm Ca2+ and 2 mm Mg2+. C, area integral (charge) of presynaptic Ca2+ currents and EPSCs are normalized and plotted on a log–log scale. According to eqn (2), Ca2+ domain cooperativity values (m) are obtained from the slope of the linear regressions: 3.0 ± 0.1 (n = 6) for WT and 4.1 ± 0.3 for KO (n = 6), P = 0.008.
Figure 2
Figure 2
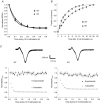
Release probability in WT and P/Q-KO synapses A, cumulative amplitude of EPSCs during 100 Hz stimulation in WT and KO mice. EPSC amplitudes are normalized to that of the first stimulus. Data are the average of n = 22 cells for WT and n = 11 cells in KO. The last six data points of the curve are fitted by linear regression and extrapolated to time zero to estimate the readily releasable pool size (N) multiplied by the mean quantal amplitude (q). The normalized Nq values obtained for WT and KO are 2.2 ± 0.3 and 2.0 ± 0.3, respectively. B, the release probability (pr) is estimated by dividing the first EPSC amplitude by Nq. There are no significant differences in the release probability between WT (pr= 0.45 ± 0.06, n = 22) and KO (pr= 0.50 ± 0.07, n = 11) synapses (P = 0.2). C, histogram showing the probability distribution of mEPSC amplitudes. Mean mEPSC amplitudes are 39 ± 2 pA in WT and 38 ± 2 pA in KO mice, while frequencies are 1.6 ± 0.4 Hz and 1.4 ± 0.5 Hz, respectively.
Figure 3
Figure 3
Recovery of EPSCs from short-term depression at 10 Hz frequency A, depression of EPSC amplitudes during 3 s stimulation at 10 Hz (conditioning train, recorded at a holding potential of −70 mV). The amplitudes are normalized to the first EPSC in the train. Data are fitted to a single exponential decay function, with a decay time constant τ= 93 ± 3 ms for WT (n = 8) and τ= 128 ± 6 ms for KO (n = 6), P = 0.07. Magnitude of depression is 22.9 ± 0.2% and 18.9 ± 0.4% of the first pulse for WT and KO, respectively. Kynurenic acid (1 mm) was added to the extracellular solution to reduce postsynaptic AMPA receptor saturation. B, time course of recovery from synaptic depression, measured by eliciting a single test EPSC at increasing time intervals following the conditioning train. The fraction of recovery is calculated as (ItestIss)/(I1Iss), where I1 and Iss are the amplitudes of the first and last EPSCs in the train and Itest is the amplitude of the test EPSC. Data are fitted to an exponential decay function of first order, with time constants τ= 4.20 ± 0.15 s (n = 8) and τ= 8.0 ± 0.4 s (n = 6) for WT and KO, respectively (P = 0.005). C, upper panel: representative traces of IpCa during application of action potential-like waveforms at the calyx of Held presynaptic terminal, at a frequency of 10 Hz, in WT and KO mice. Presynaptic calcium currents were elicited by pseudo action potential-like voltage ramps from a holding potential of −70 mV to +60 mV, rise time and plateau duration of 0.2 ms and decay time of 0.6 ms. Lower panel: normalized average peak calcium currents recorded during 10 Hz depolarization (filled symbols). There is no decrease of calcium current in synapses from either WT or KO mice, so inhibition of Ca2+ currents cannot be the cause of EPSC depression at this frequency. Open symbols are the theoretical calculation of IpCa depression needed to account for the experimentally measured EPSC depression, according to the relationship described by eqn (2) and data presented in Fig. 1C.
Figure 4
Figure 4
Recovery of EPSCs from short-term depression at 100 Hz frequency A, depression of EPSC amplitude during 100 Hz stimulation. Summary plot of average EPSC amplitudes, normalized to that of the first pulse in the train. The amplitudes of the EPSCs at the end of the stimuli are 9.7 ± 0.3% and 11.2 ± 0.5% of the first pulse for WT (n = 22) and KO (n = 11), respectively. The time course of the current decay during the train is fitted with a single exponential decay function, with a time constant τ= 16.4 ± 0.4 ms for WT and τ= 12.7 ± 0.7 ms for KO. B, recovery time course from synaptic depression was studied by eliciting a single test EPSC at varying time intervals following the conditioning train. Data are fitted to an exponential decay function of first order, with recovery time constants τ= 1.95 ± 0.05 s (n = 7) and τ= 2.62 ± 0.02 s (n = 7) for WT and KO, respectively (P = 0.043). C, upper panel: representative traces of IpCa elicited by brief depolarizations (1.2 ms at a potencial of −10 mV) at the calyx of Held presynaptic terminal, at a frequency of 100 Hz, in WT and KO mice. Lower panel: normalized average peak calcium currents recorded during 100 Hz depolarization (filled symbols). Calcium currents do not inactivate in synapses from either WT or KO mice, but there is activity-dependent facilitation in synapses from WT mice. Open symbols are the theoretical calculation of IpCa depression needed to account for the experimentally measured EPSC depression, according to the relationship described by eqn (2) and data presented in Fig. 1C.
Figure 5
Figure 5
KO mice generate similar action potential (AP) waveforms but smaller Ca2+ currents A, action potential waveforms measured at the calyx of Held presynaptic terminals of WT and KO mice, in whole cell current clamp mode. Data are the means of n = 3 and n = 7 cells for WT and KO, respectively. B, train of action potentials evoked at 100 Hz. At the right, the first (black line) and last (grey line) AP in the train are superimposed, showing no change in waveform during high frequency stimulation. C, Ca2+ currents elicited by pseudo action potential voltage ramps (−70 to + 45 mV; rise time and plateau duration of 0.2 ms, decay time of 0.6 ms) are significantly smaller in the calyx of Held presynaptic terminal of KO mice (mean peak amplitudes: 780 ± 60 pA, n = 12) than in WT ones (1060 ± 70 pA, n = 9, P = 0.004).
Figure 6
Figure 6
EPSC facilitation arises from facilitation of presynaptic calcium currents in WT mice, while no facilitation of IpCa and EPSCs is seen in KO A, simultaneous recordings of presynaptic Ca2+ currents (top) in the calyx of Held presynaptic terminal and EPSCs (bottom) in postsynaptic neurons, in WT and KO mouse, induced by two action potential-like voltage ramps (−70 to +60 mV; rise time and plateau duration of 0.2 ms, decay time of 0.6 ms), separated by 5 ms time interval. External solution contains low Ca2+ (1 mm) and high Mg2+ (2 mm), to avoid postsynaptic AMPA receptor saturation which unmasks facilitation of EPSC. B, mean magnitude of facilitation of the second IpCa with respect to the first one is 12.8 ± 0.8% in WT and −2.2 ± 2.5% in KO. The average induced facilitation of EPSCs is 46.5 ± 6.6% for WT and 5.2 ± 3.9% for KO. The arrow indicates the expected EPSC facilitation caused by a 12.8% facilitation in IpCa, estimated to be 43% according to the power relationship expressed by eqn (2), with m = 3.0.
Figure 7
Figure 7
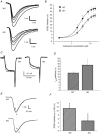
Synaptic transmission at KO synapses is more susceptible to presynaptic inhibition by GABAB receptors A, EPSCs were evoked in MNTB neurons by stimulation with a bipolar electrode placed at the midline of the brainstem slice (stimuli of 0.1 ms duration and 3–10 V amplitude), and recorded under whole-cell voltage clamp conditions at a holding potential of −70 mV, during application of the GABAB receptor agonist baclofen in the bath solution. Each trace is the average of 5–8 EPSCs recorded in control conditions and after application of successive baclofen doses: (0.02, 0.05, 0.1, 0.2, 0.3, 0.5, 0.7, 1.5 μm for WT and 0.02, 0.04, 0.06, 0.08, 0.1, 0.2 μm for KO). B, concentration–response relationship for baclofen induced inhibition of the calyx of Held–MNTB transmission (presented as percentage of inhibition relative to the EPSC recorded in control conditions). Curves are well fitted by a Hill equation. Maximum EPSC inhibition is 65.6 ± 2.3% and 87.8 ± 1.1% (P = 0.028) and IC50 values are 0.16 ± 0.01 μm and 0.051 ± 0.001 μm (P = 0.018) for WT (n = 6) and KO (n = 5), respectively. C, presynaptic calcium current inhibition by GABAB receptors activation. Presynaptic calcium currents elicited by stepping the voltage to −10 mV for 10 ms from a holding potential of −70 mV, before and after (bold trace) application of 2 μm baclofen, in WT and KO mice. Activation rate of IpCa becomes slower and its amplitudes smaller. D, plot summarizing the calcium current inhibition by 2 μm of baclofen in WT (n = 7) and KO mice (n = 5). The current change is presented as percentage inhibition relative to the calcium current recorded in control conditions (20 ± 3% in WT and 52 ± 6% in KO, P = 0.003). Ca2+ currents were measured 3 ms after the depolarizing voltage step. E, depolarization voltage steps to +100 mV for 20 ms relieve baclofen mediated inhibition of Ca2+ currents. Traces show the Ca2+ current before (in bold) and after the depolarizing voltage step to +100 mV in WT and KO mice. Note the stronger inhibition relief in KO mice.
Figure 8
Figure 8
A, presynaptic inhibition of EPSCs mediated by adenosine. Representative traces of EPSCs evoked in MNTB neurons under whole-cell voltage clamp conditions at a holding potential of −70 mV during bath application of different concentrations of adenosine. Each trace is the average of 5–8 EPSC recordings in control conditions and after application of 4, 8, 12 and 20 μm of adenosine. B, concentration–response relationship for adenosine induced inhibition of the calyx of Held–MNTB transmission. Experimental data have been fitted by a Hill equation. Maximum inhibition is 36.10 ± 0.34% and 46.1 ± 0.2%, and concentration for half current inhibition is 4.14 ± 0.06 μm and 2.91 ± 0.02 μm in neurons from WT (n = 6) and KO (n = 5), respectively. Hill coefficient is 1.79 ± 0.04 and 1.78 ± 0.02 for WT and KO. C, presynaptic calcium current inhibition by adenosine. Presynaptic calcium currents elicited by stepping the voltage to −10 mV for 10 ms from a holding potential of −70 mV, before and after (bold trace) application of 20–50 μm of adenosine, in WT and KO mice. Activation rate of IpCa becomes slower and its amplitude smaller. D, plot summarizing the calcium current inhibition by adenosine in WT (n = 4) and KO mice (n = 5). Saturated concentrations of adenosine (20–50 μm) applied via perfusion reduce the amplitude of IpCa (measured 3 ms after the onset of the pulse) by 13 ± 1% in WT (n = 4) and 19 ± 5% in KO (n = 5), relative to the calcium current recorded in control conditions. E, metabotropic glutamate receptors have no effect on WT and KO synapses. Representative traces of EPSCs evoked in two different MNTB neurons under whole-cell voltage clamp conditions at a holding potential of −70 mV, before (a) and after (b) application of the selective agonist of group III mGluR, l-AP4, at a saturated concentration of 100 μm. Each trace is the average of 4–6 EPSCs responses. F, mean inhibition of EPSC by 100 μm of l-AP4 is 11.2 ± 2.6% relative to the current recorded in control conditions, for WT mice (n = 9) and 5.0 ± 3.5% (n = 4), for KO mice.

Similar articles

Cited by

References

    1. Barnes-Davies M, Forsythe ID. Pre- and postsynaptic glutamate receptors at a giant excitatory synapse in rat auditory brainstem slices. J Physiol. 1995;488:387–406. - PMC - PubMed
    1. Basu J, Betz A, Brose N, Rosenmund C. Munc13–1, C1 domain activation lowers the energy barrier for synaptic vesicle fusion. J Neurosci. 2007;27:1200–1210. - PMC - PubMed
    1. Borst JG, Sakmann B. Effect of changes in action potential shape on calcium currents and transmitter release in a calyx-type synapse of the rat auditory brainstem. Philos Trans R Soc Lond B Biol Sci. 1999;354:347–355. - PMC - PubMed
    1. Bourinet ET, Soong TW, Stea A, Snutch TP. Determinants of the G protein-dependent opioid modulation of neuronal calcium channels. Proc Natl Acad Sci U S A. 1996;93:1486. - PMC - PubMed
    1. Currie KP, Fox AP. ATP serves as a negative feedback inhibitor of voltage-gated Ca2+ channel currents in cultured bovine adrenal chromaffin cells. Neuron. 1996;16:1027–1036. - PubMed

Publication types

LinkOut - more resources