. 2007 Nov 1;584(Pt 3):867-83.
doi: 10.1113/jphysiol.2007.138131. Epub 2007 Sep 6.

Factors defining a pacemaker region for synchrony in the hippocampus

Affiliations

Factors defining a pacemaker region for synchrony in the hippocampus

Lucia Wittner et al. J Physiol. .

Abstract

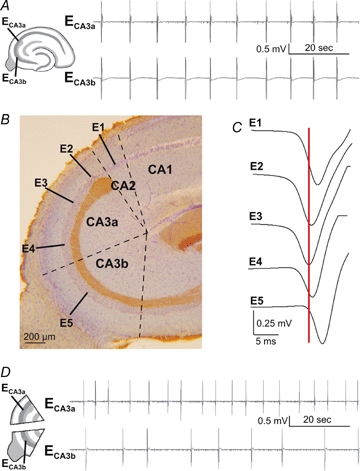
Synchronous activities of neuronal populations are often initiated in a pacemaker region and spread to recruit other regions. Here we examine factors that define a pacemaker site. The CA3a region acts as the pacemaker for disinhibition induced synchrony in guinea pig hippocampal slices and CA3b is a follower region. We found CA3a pyramidal cells were more excitable and fired in bursts more frequently than CA3b cells. CA3a cells had more complex dendritic arbors than CA3b cells especially in zones targetted by recurrent synapses. The product of the density of pyramidal cell axon terminals and dendritic lengths in innervated zones predicted a higher recurrent synaptic connectivity in the CA3a than in the CA3b region. We show that some CA3a cells but few CA3b cells behave as pacemaker cells by firing early during population events and by recruiting follower cells to fire. With a greater excitability and enhanced synaptic connectivity these CA3a cells may also possess initiating functions for other hippocampal ensemble activities initiated in this region.


Figures

Figure 1
Figure 1
Pacemaker role of the CA3a region in disinhibition-induced synchrony A, epileptiform field potentials recorded from the CA3a, ECA3a, and CA3b, ECA3b, regions of a guinea-pig hippocampal slice exposed to 20 μm bicuculline. B, the CA3 region, with cell bodies indicated by blue Nissl staining and the mossy fibres coloured brown by immunostaining for Calbindin. The CA2, CA3a and CA3b zones are defined with dashed lines. Positions of recording electrodes E1–E5 for C. C, the initiation of field potentials at five sites in stratum pyramidale from CA2 to CA3b. Averages of 60 events show that the E3 electrode in mid-CA3a leads. D, exposure to bicuculline (20 μm) induces rhythmic activity in separated mini-slices of the CA3a and CA3b regions (both ∼800 μm along stratum pyramidale). The frequency of activity from the CA3a segment is faster than that from CA3b.
Figure 5
Figure 5
Differences in miniature synaptic events in CA3a and CA3b cells AB, miniature EPSPs recorded from CA3a and CA3b cells in 0.1 μm tetrodotoxin and 10 μm bicuculline. C and D, the distribution of mEPSP amplitudes (C) and the cumulative probability plot (D) show that larger amplitude miniature synaptic events tended to be more frequent in CA3a cells (n = 7) than in CA3b cells (n = 7). E, miniature EPSP frequency was higher in CA3a cells (n = 5) than in CA3b cells (n = 5, P < 0.05, t test).
Figure 7
Figure 7
Influence of single cells on population activity A, firing induced in single cells (top trace) elicited local field potentials (lower traces). B, field potentials could be associated with increased multi unit activity. In these records synaptic inhibition was blocked (20 μm bicuculline). Either excitability was reduced (4 mm Ca, 4 mm Mg) to abolish epileptiform events or the effects of single cell firing were tested between population bursts. C, the latency of the field potential in the interaction from B was about 6 ms. Average of 100 traces. D, in another interaction, pyramidal cell firing elicited unit discharges of similar form at short latency. Note that the second action potential failed occasionally. E, CA3a cells initiate increased multi unit firing (right panel) either in CA3a or in CA3b regions in a significantly more efficient manner than CA3b cells (P < 0.05, Fisher's exact test). About half of the cells in both regions are able to induce local field potential (right panel).
Figure 2
Figure 2
CA3a pyramidal cells are more excitable than CA3b cells Aa and Ba, comparison of intracellular (upper) and extracellular (lower) activity of CA3a and CA3b pyramidal cells. CA3a pyramidal cells tend to fire in bursts (Ab) somewhat more than CA3b cells (Bb). Multi-unit extracellular records reveal a higher level of spontaneous spiking in the CA3a region. Ac and Bc, visualization of biocytin-filled CA3a and CA3b cells. Comparison of firing threshold and depolarizing after-potential (C), proportion of spontaneously active cells (D) and bursting cells in the CA3a and CA3b regions (E). Scale bars for C: 2 mV, 5 ms.
Figure 3
Figure 3
CA3a cells have longer and more exuberant dendrites than CA3b pyramidal cells A–C, reconstructions of dendritic branching for representative pyramidal cells from the CA2, CA3a and CA3b regions. A Sholl plot of total dendritic length against distance from the soma is shown at the right for mean values derived from dendrites of 5 CA2 cells, 5 CA3a cells and 6 CA3b cells. Apical dendrites of CA3a pyramidal cells branch within 50 μm of the soma in stratum lucidum more frequently than those of CA2 and CA3b cells (arrowhead). CA3a apical dendrites also branch more exuberantly at the stratum lucidum–radiatum border (arrow). The Sholl plots reveal a greater total dendritic length of CA3a cells than for CA3b or CA2 cells. It depends on the more profuse branching in stratum oriens and radiatum (arrow) and a greater maximal dendritic length (arrow). LM: stratum lacunosum-moleculare; Re: external stratum radiatum; Ri: internal stratum radiatum; L: stratum lucidum; P: stratum pyramidale; O: stratum oriens.
Figure 4
Figure 4
Mapping theoretical recurrent connectivity in CA3a and CA3b regions A, axon collaterals and terminals of a CA3b pyramidal cell in the stratum oriens of CA3a. B, reconstruction of the dendrites (black) and terminals (blue) of this cell. LM: stratum lacunosum-moleculare; Re: external stratum radiatum; Ri: internal stratum radiatum; L: stratum lucidum; P: stratum pyramidale; O: stratum oriens. C, mean axon terminal distributions for CA3a (left, n = 13) and CA3b (right n = 9) pyramidal cells, mapped onto a standard CA3 region. Each square of the standard CA3 region represents 100 × 100 × 400 μm, where 400 μm is the slice thickness. The mean number of terminals in each volume is colour-coded. D, mean dendritic length of CA3a (left, n = 5) and CA3b (right, n = 6) pyramidal cells, colour-coded and plotted onto the standard CA3 region. The soma of each reconstructed pyramidal cell was displaced to the same site. E, estimate of the number of terminals, from both CA3a and CA3b cells, that could contact dendrites of a single CA3a (left) or CA3b (right) pyramidal cell.
Figure 6
Figure 6
The CA3a region possesses more pacemaker cells A, five sequential multi unit records show population events are preceded by more spikes in the CA3a region (top) than in CA3b (bottom). The sixth trace for CA3a and CA3b is an averaged field potential showing a ramp deflection that emerges first in CA3a. All records made in 10 μm bicuculline. BD, distinct patterns of single cell activity before spontaneously occurring epileptiform events. Intracellular record (top trace), extracellular field (bottom trace) and raster plots of spike timing for 12 sequential events (middle). In strong pacemaker cells (B) firing occurred more than 20 ms before the population field potential both at rest (spontaneous) and from potentials of −70 to −80 mV (hyperpolarized). In weak pacemaker cells (C) firing preceded the local field only at rest. In follower cells firing never preceded the local field. Spike timing was measured from more than 50 events at both potentials. E, more pacemaker cells were recorded from the CA3a region and more follower cells from the CA3b region. Strong pacemaker cells were only observed in CA3a.
Figure 8
Figure 8
Diagram of factors underlying the pacemaker role This figure summarizes the properties of the pacemaker region and their role in population burst initiation in the disinhibited hippocampal slice. High intrinsic cellular excitability and recurrent synaptic input (i/p) characterize cells in the pacemaker region and may facilitate cell firing in the initiating phase. More efficient recurrent output (o/p) and EPSP-spike coupling might help recruiting other cells and other regions to the population burst.

Similar articles

Cited by

References

    1. Amaral DG, Ishizuka N, Claiborne B. Neurons, numbers and the hippocampal network. Prog Brain Res. 1990;83:1–11. - PubMed
    1. Aton SJ, Herzog ED. Come together, right…now: synchronization of rhythms in a mammalian circadian clock. Neuron. 2005;48:531–534. - PMC - PubMed
    1. Azouz R, Jensen MS, Yaari Y. Ionic basis of spike after-depolarization and burst generation in adult rat hippocampal CA1 pyramidal cells. J Physiol. 1996;492:211–223. - PMC - PubMed
    1. Baimbridge KG, Miller JJ. Immunohistochemical localization of calcium-binding protein in the cerebellum, hippocampal formation and olfactory bulb of the rat. Brain Res. 1982;245:223–229. - PubMed
    1. Bartesaghi R, Severi S. Effects of early environment on field CA3a pyramidal neuron morphology in the guinea-pig. Neuroscience. 2002;110:475–488. - PubMed

Publication types

LinkOut - more resources