. 2008 Jan;101(1):65-80.
doi: 10.1093/toxsci/kfm238. Epub 2007 Sep 6.

Identification of a transcriptional fingerprint of estrogen exposure in rainbow trout liver

Affiliations

Identification of a transcriptional fingerprint of estrogen exposure in rainbow trout liver

Abby D Benninghoff et al. Toxicol Sci. 2008 Jan.

Abstract

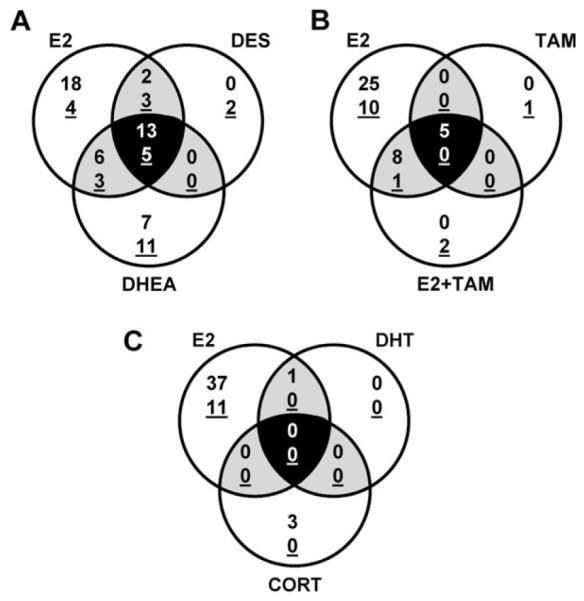
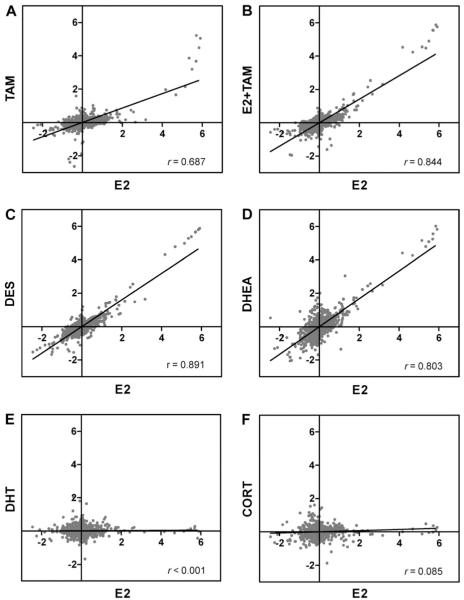
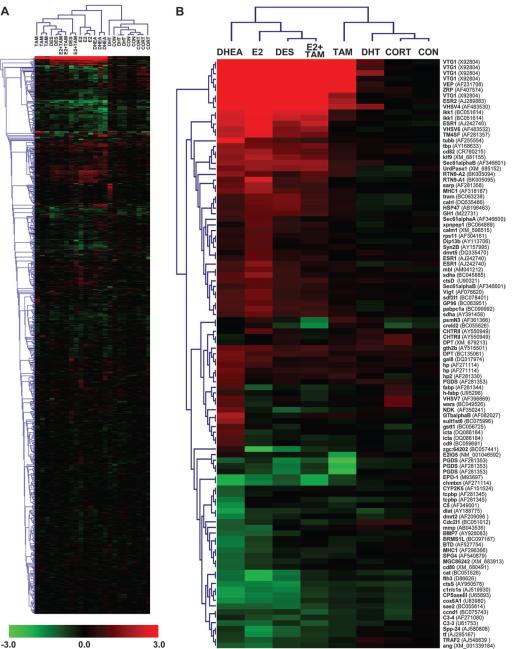
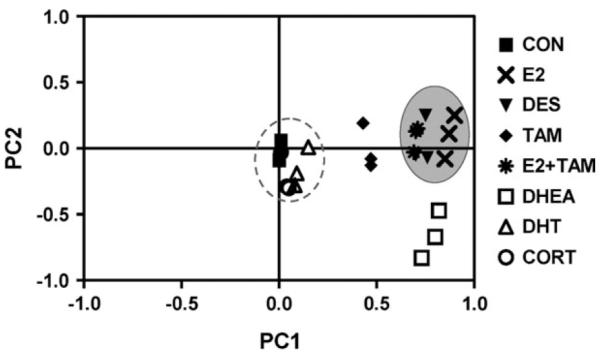
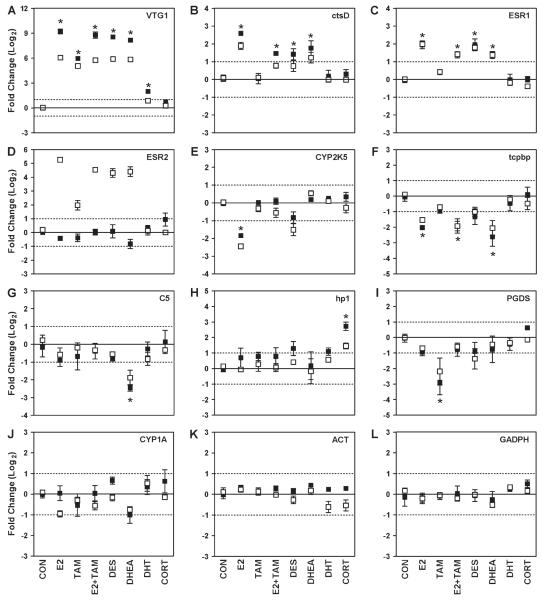
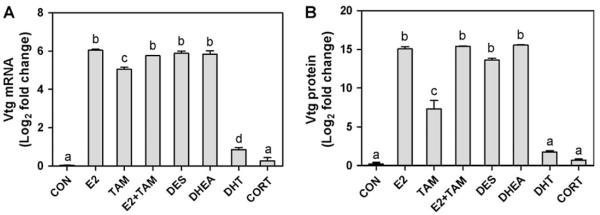
The goal of this study was to identify a set of hepatic genes regulated by ligand-dependent activation of the estrogen receptor in juvenile rainbow trout (Oncorhynchus mykiss). A custom rainbow trout oligo DNA microarray, which contains probes targeting approximately 1450 genes relevant to carcinogenesis, toxicology, endocrinology, and stress physiology was utilized to identify transcriptional fingerprints of in vivo dietary exposure to 17 beta-estradiol (E2), tamoxifen (TAM), estradiol + tamoxifen (E2 + TAM), diethylstilbestrol (DES), dehydroepiandrosterone (DHEA), dihydrotestosterone (DHT), and cortisol (CORT). Estrogen exposure altered the expression of up to 49 genes involved in reproduction, immune response, cell growth, transcriptional regulation, protein synthesis and modification, drug metabolism, redox regulation, and signal transduction. E2, DES, and DHEA regulated 18 genes in common, mostly those associated with vitellogenesis, cell proliferation, and signal transduction. Interestingly, DHEA uniquely regulated several complement component genes of importance to immune response. While the effect of TAM on E2-induced changes in gene expression was mostly antagonistic, TAM alone increased expression of VTG1 and other genes associated with egg development and immune response. Few genes responded to CORT treatment, and DHT significantly altered expression of only one gene targeted by the OSUrbt array. Hierarchical cluster and principal components analyses revealed distinct patterns of gene expression corresponding to estrogens and non-estrogens, though unique patterns could also be detected for individual chemicals. A set of estrogen-responsive genes has been identified that can serve as a biomarker of environmental exposure to xenoestrogens.


Figures

FIG. 1
FIG. 1
Venn diagrams depicting overlap of differentially regulated genes among the experimental treatments, which are grouped to compare E2-induced changes in hepatic gene expression to genes regulated by (A) DES and DHEA treatments, (B) TAM and E2 + TAM and (C) DHT and CORT. Numbers of genes that were significantly induced or repressed (underlined) by experimental treatments are indicated.
FIG. 2
FIG. 2
Pairwise correlation of E2-induced hepatic gene expression compared to (A) TAM, (B) E2 + TAM, (C) DES, (D) DHEA, (E) DHT, and (F) CORT. Values are the geometric mean of fold change (log2) compared to the control reference pool for each array feature (n = 3). All array features are plotted pairwise between E2 and each experimental treatment to generate correlation graphs. Pearson correlation (r) values are indicated for each comparison.
FIG. 3
FIG. 3
Unsupervised cluster analyses of estrogen and non-estrogen-induced changes in hepatic gene expression. Bidirectional hierarchical clustering analyses were performed using sample data for either (A) all array features or (B) a subgroup of genes that were significantly regulated in at least one treatment. Patterns of gene expression were clustered in two directions, by gene (left tree) and treatment (top tree), using the Euclidean distance method with average linkage. Log2 fold change expression values are shown for each biological replicate (n = 3) in panel A, and the mean log2 fold change is shown in panel B. Expression values are colored according to the indicated scale: red, up-regulation; green, down-regulation; black, unchanged expression. Abbreviations and GenBank accession numbers are indicated for each gene in panel B.
FIG. 4
FIG. 4
Principal components analysis was performed for all experimental treatments. PC1 and PC2 are shown and account for 84.2 and 3.2% of experiment variance, respectively. A group of symbols representing non-estrogen treatments is indicated by a hatched gray circle, and a group of estrogen treatments is indicated by a solid gray circle.
FIG. 5
FIG. 5
Validation of treatment-induced changes in hepatic gene expression determined by microarray analysis using qRT-PCR. Values from qRT-PCR (solid squares) are expressed as mean fold change (log2) normalized to ACT and GAPDH and values from the OSUrbt microarray (open squares) are expressed as mean fold change (log2) compared to the control reference pool ± SEM (n = 3) for select genes including (A) VTG1, (B) ctsD, (C) ESR1, (D) ESR2, (E) CYP2K5, (F) tcpbp, (G) C5, (H) hp1, (I) PGDS and (J) CYP1A. qRT-PCR and array expression levels of the normalization genes are also shown in (K) ACT and (L) GADPH. *indicates that the qRT-PCR expression value is significantly different ( p < 0.05) from control as determined by a one-way ANOVA with Dunnett’s test for multiple comparisons. Results of statistical analyses of microarray data are summarized in Tables 3–5, and p values are provided in Supplementary Tables 2 and 3.
FIG. 6
FIG. 6
Comparison of hepatic Vtg mRNA expression to blood plasma Vtg protein levels. (A) Hepatic Vtg gene expression was measured using the OSUrbt microarray. Values are mean fold change (log2) compared to the reference pool + SEM (n = 3). (B) Blood plasma Vtg protein levels are shown as mean fold change (log2) compared to control + SEM (n = 3); equal volumes of blood plasma from four males from each of three tanks were pooled, as was done for the liver samples in the microarray experiment. Actual Vtg plasma levels ranged from 2.16 × 10² to 1.03 × 10⁷ ng/ml (for CON and DHEA treatments, respectively). Different letters indicate that treatments are significantly different from each other ( p < 0.05) as determined by one-way ANOVA with Tukey’s test for multiple comparisons.

References

    1. Arukwe A, Goksøyr A. Eggshell and egg yolk proteins in fish: Hepatic proteins for the next generation: Oogenetic, population, and evolutionary implications of endocrine disruption. Comp. Hepatol. 2003;2:4. - PMC - PubMed
    1. Bao L, Quigg RJ. Complement in lupus nephritis: The good, the bad, and the unknown. Semin. Nephrol. 2007;27:69–80. - PubMed
    1. Bartosiewicz MJ, Jenkins D, Penn S, Emery J, Buckpitt A. Unique gene expression patterns in liver and kidney associated with exposure to chemical toxicants. J. Pharmacol. Exp. Ther. 2001;297:895–905. - PubMed
    1. Benninghoff AD. Toxicoproteomics–the next step in the evolution of environmental biomarkers. Toxicol. Sci. 2007;95:1–4. - PubMed
    1. Blum JL, Knoebl I, Larkin P, Kroll KJ, Denslow ND. Use of suppressive subtractive hybridization and cDNA arrays to discover patterns of altered gene expression in the liver of dihydrotestosterone and 11-ketotestosterone exposed adult male largemouth bass (Micropterus salmoides) Mar. Environ. Res. 2004;58:565–569. - PubMed

Publication types

MeSH terms