

Osteopontin mediates obesity-induced adipose tissue macrophage infiltration and insulin resistance in mice
- PMID: 17823662
- PMCID: PMC1964510
- DOI: 10.1172/JCI31986
Osteopontin mediates obesity-induced adipose tissue macrophage infiltration and insulin resistance in mice
Abstract
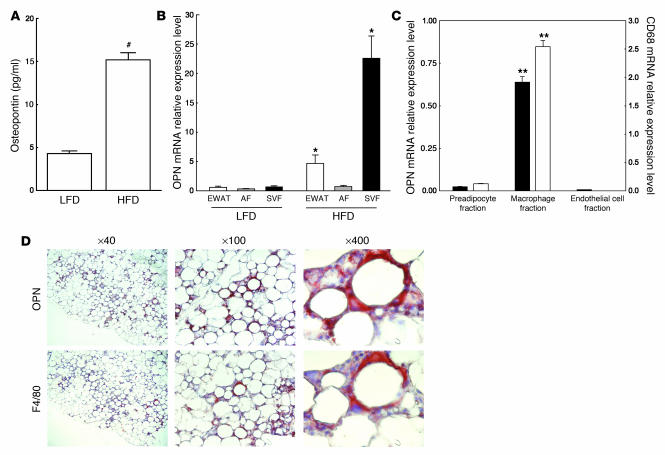
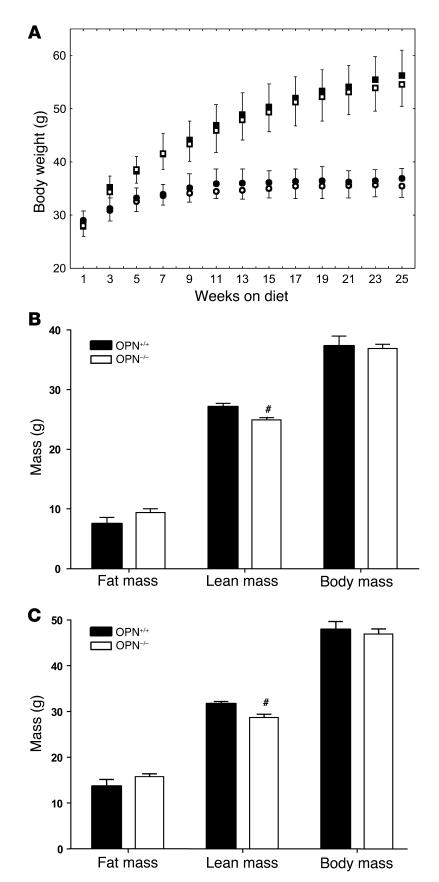
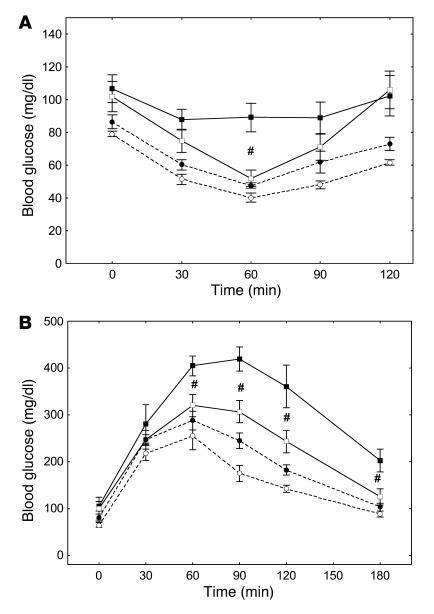
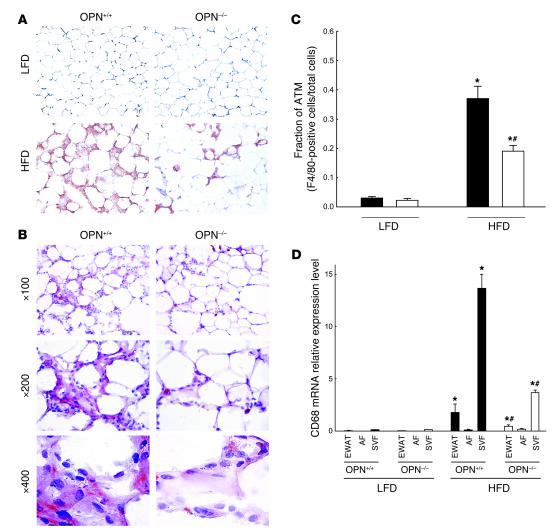
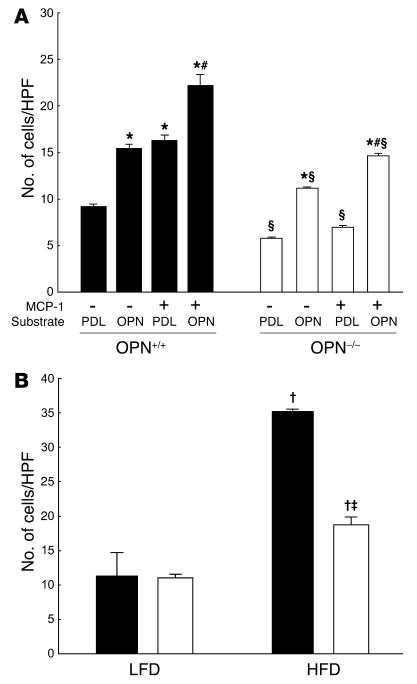
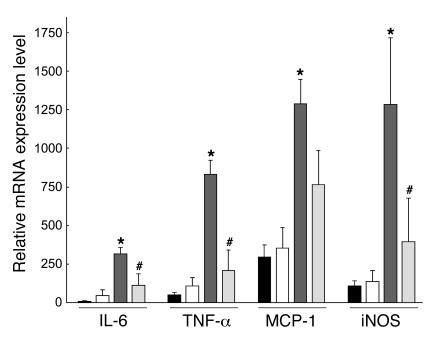
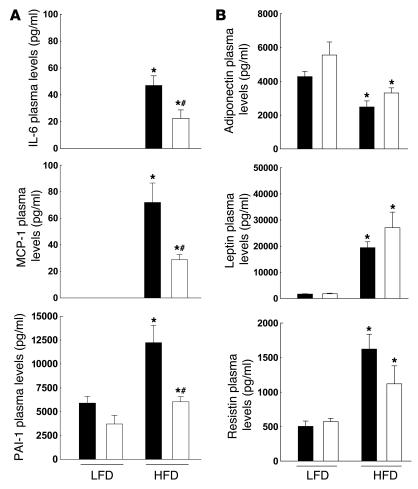
Obesity is associated with a state of chronic, low-grade inflammation characterized by abnormal cytokine production and macrophage infiltration into adipose tissue, which may contribute to the development of insulin resistance. During immune responses, tissue infiltration by macrophages is dependent on the expression of osteopontin, an extracellular matrix protein and proinflammatory cytokine that promotes monocyte chemotaxis and cell motility. In the present study, we used a murine model of diet-induced obesity to examine the role of osteopontin in the accumulation of adipose tissue macrophages and the development of insulin resistance during obesity. Mice exposed to a high-fat diet exhibited increased plasma osteopontin levels, with elevated expression in macrophages recruited into adipose tissue. Obese mice lacking osteopontin displayed improved insulin sensitivity in the absence of an effect on diet-induced obesity, body composition, or energy expenditure. These mice further demonstrated decreased macrophage infiltration into adipose tissue, which may reflect both impaired macrophage motility and attenuated monocyte recruitment by stromal vascular cells. Finally, obese osteopontin-deficient mice exhibited decreased markers of inflammation, both in adipose tissue and systemically. Taken together, these results suggest that osteopontin may play a key role in linking obesity to the development of insulin resistance by promoting inflammation and the accumulation of macrophages in adipose tissue.
Figures
Similar articles
-
Macrophage migration inhibitory factor deficiency ameliorates high-fat diet induced insulin resistance in mice with reduced adipose inflammation and hepatic steatosis.PLoS One. 2014 Nov 20;9(11):e113369. doi: 10.1371/journal.pone.0113369. eCollection 2014. PLoS One. 2014. PMID: 25412423 Free PMC article.
-
Fats, inflammation and insulin resistance: insights to the role of macrophage and T-cell accumulation in adipose tissue.Proc Nutr Soc. 2011 Nov;70(4):408-17. doi: 10.1017/S0029665111000565. Epub 2011 Aug 12. Proc Nutr Soc. 2011. PMID: 21835098 Review.
-
Exercise training inhibits inflammation in adipose tissue via both suppression of macrophage infiltration and acceleration of phenotypic switching from M1 to M2 macrophages in high-fat-diet-induced obese mice.Exerc Immunol Rev. 2010;16:105-18. Exerc Immunol Rev. 2010. PMID: 20839495
-
CTLA-4Ig immunotherapy of obesity-induced insulin resistance by manipulation of macrophage polarization in adipose tissues.Biochem Biophys Res Commun. 2013 Aug 16;438(1):103-9. doi: 10.1016/j.bbrc.2013.07.034. Epub 2013 Jul 18. Biochem Biophys Res Commun. 2013. PMID: 23872146
-
Do adipose tissue macrophages promote insulin resistance or adipose tissue remodelling in humans?Horm Mol Biol Clin Investig. 2014 Oct;20(1):3-13. doi: 10.1515/hmbci-2014-0036. Horm Mol Biol Clin Investig. 2014. PMID: 25460290 Review.
Cited by
-
Osteopontin: The Molecular Bridge between Fat and Cardiac-Renal Disorders.Int J Mol Sci. 2020 Aug 4;21(15):5568. doi: 10.3390/ijms21155568. Int J Mol Sci. 2020. PMID: 32759639 Free PMC article. Review.
-
The Role of Osteopontin in Respiratory Health and Disease.J Pers Med. 2023 Aug 14;13(8):1259. doi: 10.3390/jpm13081259. J Pers Med. 2023. PMID: 37623509 Free PMC article. Review.
-
Anti-CD44 antibody treatment lowers hyperglycemia and improves insulin resistance, adipose inflammation, and hepatic steatosis in diet-induced obese mice.Diabetes. 2015 Mar;64(3):867-75. doi: 10.2337/db14-0149. Epub 2014 Oct 7. Diabetes. 2015. PMID: 25294945 Free PMC article.
-
Lactoferrin, Osteopontin and Lactoferrin-Osteopontin Complex: A Critical Look on Their Role in Perinatal Period and Cardiometabolic Disorders.Nutrients. 2023 Mar 14;15(6):1394. doi: 10.3390/nu15061394. Nutrients. 2023. PMID: 36986124 Free PMC article. Review.
-
Does osteopontin induce adipose tissue inflammation by local macrophage proliferation?Mol Metab. 2016 Oct 14;5(12):1147-1148. doi: 10.1016/j.molmet.2016.10.002. eCollection 2016 Dec. Mol Metab. 2016. PMID: 27900257 Free PMC article. No abstract available.
References
Publication types
MeSH terms
Substances
Grants and funding
LinkOut - more resources
Full Text Sources
Other Literature Sources
Medical
Molecular Biology Databases
Research Materials
