The importance of comparative phylogeography in diagnosing introduced species: a lesson from the seal salamander, Desmognathus monticola
- PMID: 17825102
- PMCID: PMC2020456
- DOI: 10.1186/1472-6785-7-7
The importance of comparative phylogeography in diagnosing introduced species: a lesson from the seal salamander, Desmognathus monticola
Abstract
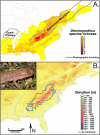
Background: In most regions of the world human influences on the distribution of flora and fauna predate complete biotic surveys. In some cases this challenges our ability to discriminate native from introduced species. This distinction is particularly critical for isolated populations, because relicts of native species may need to be conserved, whereas introduced species may require immediate eradication. Recently an isolated population of seal salamanders, Desmognathus monticola, was discovered on the Ozark Plateau, approximately 700 km west of its broad continuous distribution in the Appalachian Mountains of eastern North America. Using Nested Clade Analysis (NCA) we test whether the Ozark isolate results from population fragmentation (a natural relict) or long distance dispersal (a human-mediated introduction).
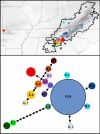
Results: Despite its broad distribution in the Appalachian Mountains, the primary haplotype diversity of D. monticola is restricted to less than 2.5% of the distribution in the extreme southern Appalachians, where genetic diversity is high for other co-distributed species. By intensively sampling this genetically diverse region we located haplotypes identical to the Ozark isolate. Nested Clade Analysis supports the hypothesis that the Ozark population was introduced, but it was necessary to include haplotypes that are less than or equal to 0.733% divergent from the Ozark population in order to arrive at this conclusion. These critical haplotypes only occur in < 1.2% of the native distribution and NCA excluding them suggest that the Ozark population is a natural relict.
Conclusion: Our analyses suggest that the isolated population of D. monticola from the Ozarks is not native to the region and may need to be extirpated rather than conserved, particularly because of its potential negative impacts on endemic Ozark stream salamander communities. Diagnosing a species as introduced may require locating nearly identical haplotypes in the known native distribution, which may be a major undertaking. Our study demonstrates the importance of considering comparative phylogeographic information for locating critical haplotypes when distinguishing native from introduced species.
Figures


Similar articles
-
Speciation, phylogeography and evolution of life history and morphology in plethodontid salamanders of the Eurycea multiplicata complex.Mol Ecol. 2004 May;13(5):1189-203. doi: 10.1111/j.1365-294X.2004.02130.x. Mol Ecol. 2004. PMID: 15078455
-
Testing Pleistocene refugia theory: phylogeographical analysis of Desmognathus wrighti, a high-elevation salamander in the southern Appalachians.Mol Ecol. 2003 Apr;12(4):969-84. doi: 10.1046/j.1365-294x.2003.01797.x. Mol Ecol. 2003. PMID: 12753216
-
The phylogenetics of Desmognathine salamander populations across the southern Appalachians.Mol Phylogenet Evol. 2003 May;27(2):197-211. doi: 10.1016/s1055-7903(02)00405-0. Mol Phylogenet Evol. 2003. PMID: 12695085
-
Gene lineages and eastern North American palaeodrainage basins: phylogeography and speciation in salamanders of the Eurycea bislineata species complex.Mol Ecol. 2006 Jan;15(1):191-207. doi: 10.1111/j.1365-294X.2005.02757.x. Mol Ecol. 2006. PMID: 16367840
-
Chloroplast DNA phylogeography of Clintoniaudensis Trautv. & Mey. (Liliaceae) in East Asia.Mol Phylogenet Evol. 2010 May;55(2):721-32. doi: 10.1016/j.ympev.2010.02.010. Epub 2010 Feb 19. Mol Phylogenet Evol. 2010. PMID: 20172032 Review.
References
-
- Walker B, Steffen W. An overview of the implications of global change for natural and managed terrestrial ecosystems. Conservation Ecology. 1997;1:2.
-
- Wilcove DS, Rothstein D, Dubowe J, Phillips A, Losos E. Quantifying threats to imperiled species in the United States. BioScience. 1998;48:607–615. doi: 10.2307/1313420. - DOI
-
- Sala OE, Chapin FS, Armesto JJ, Berlow E, Bloomfield J, Dirzo R, Huber-Sanwald E, Huenneke LF, Jackson RB, Kinzig A, Leemans R, Lodge DM, Mooney HA, Oesterheld M, Poff NL, Sykes MT, Walker BH, Walker M, Wall DH. Global Biodiversity Scenarios for the Year 2100. Science. 2000;287:1770–1774. doi: 10.1126/science.287.5459.1770. - DOI - PubMed
-
- Ruesink JL, Parker IM, Groom MJ, Kareiva PM. Reducing the risks of nonindigenous species introductions: guilty until proven innocent. BioScience. 1995;45:465–477. doi: 10.2307/1312790. - DOI
Publication types
MeSH terms
Substances
LinkOut - more resources
Full Text Sources

