Comparative Study
. 2007 Sep;47(21):2751-66.
doi: 10.1016/j.visres.2007.07.014. Epub 2007 Sep 6.

Wave aberrations in rhesus monkeys with vision-induced ametropias

Affiliations
Comparative Study

Wave aberrations in rhesus monkeys with vision-induced ametropias

Ramkumar Ramamirtham et al. Vision Res. 2007 Sep.

Abstract

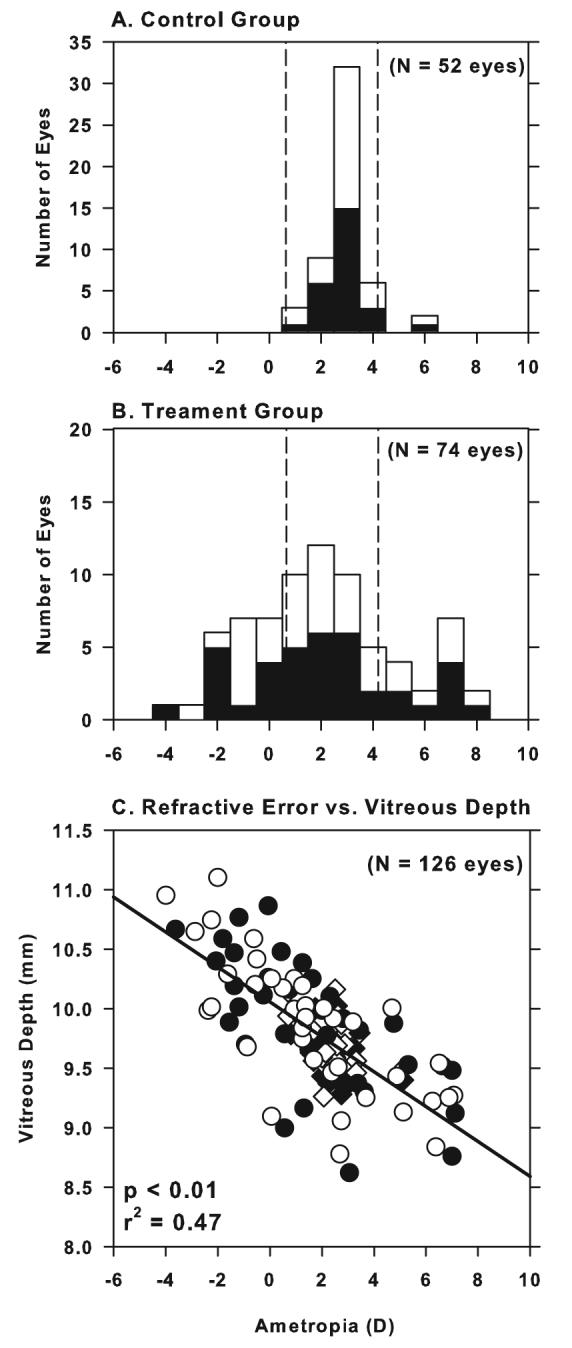
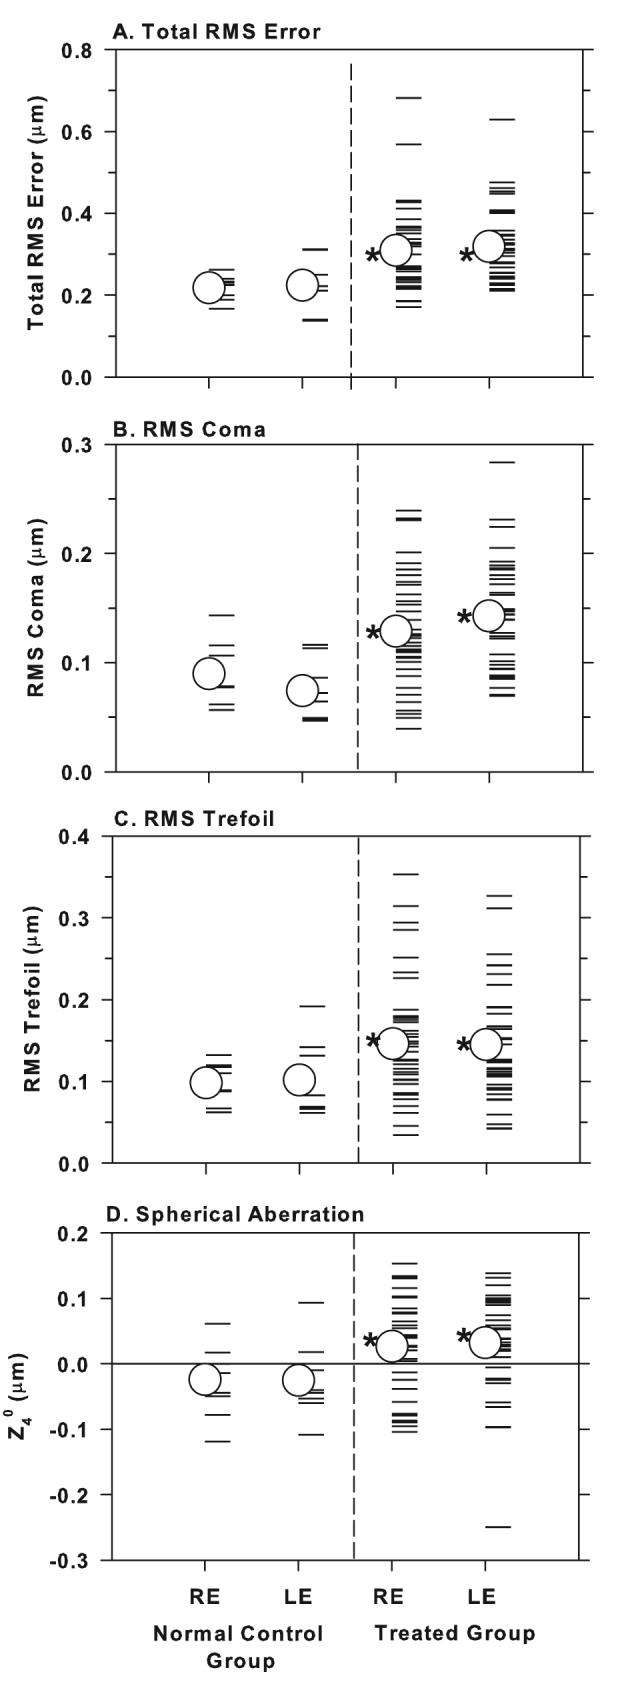
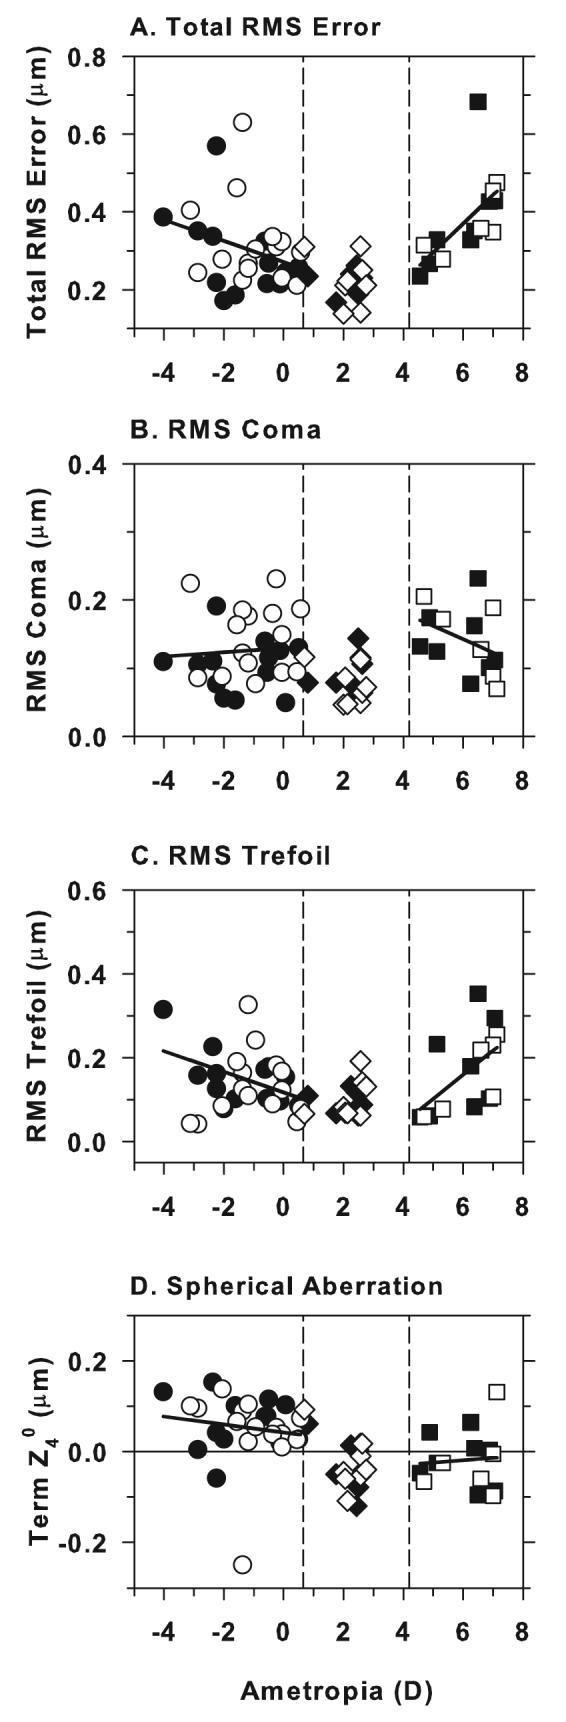
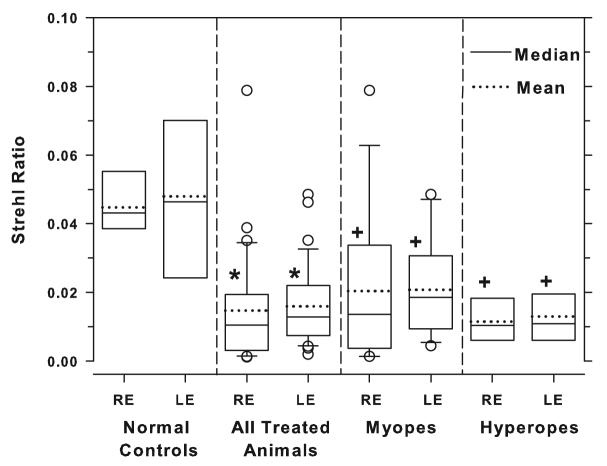
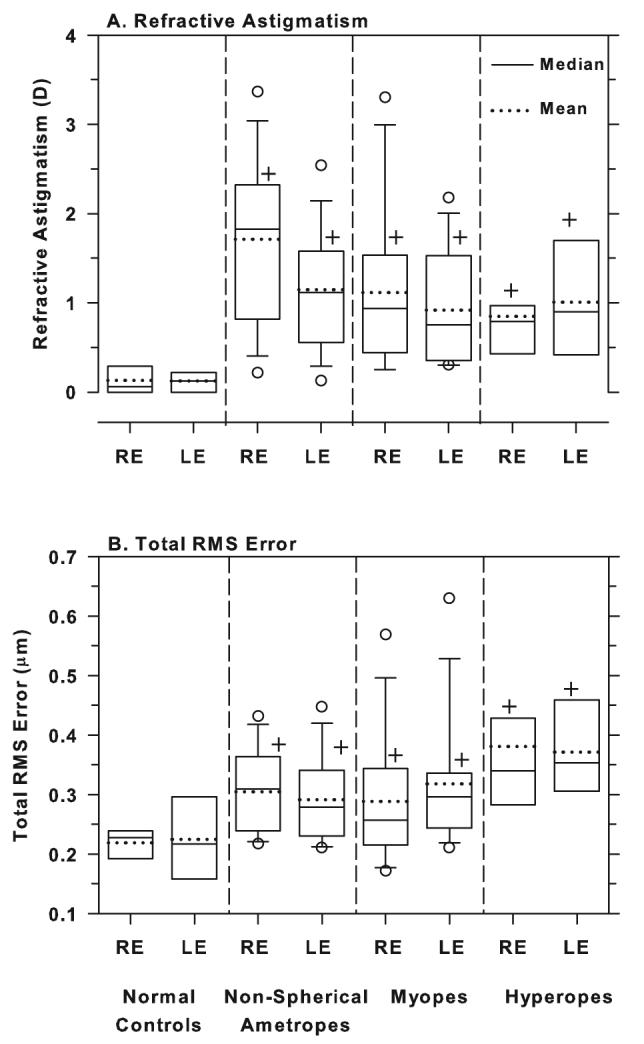
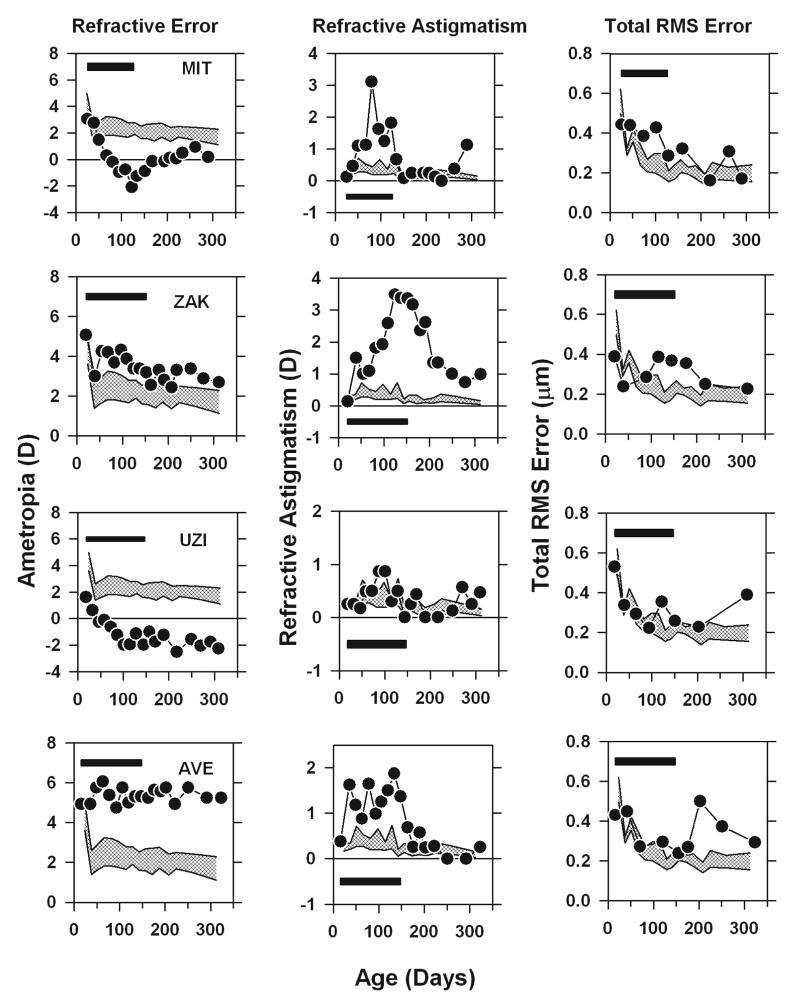
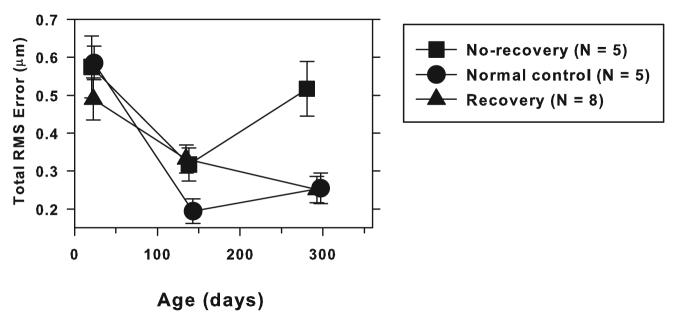
The purpose of this study was to investigate the relationship between refractive errors and high-order aberrations in infant rhesus monkeys. Specifically, we compared the monochromatic wave aberrations measured with a Shack-Hartman wavefront sensor between normal monkeys and monkeys with vision-induced refractive errors. Shortly after birth, both normal monkeys and treated monkeys reared with optically induced defocus or form deprivation showed a decrease in the magnitude of high-order aberrations with age. However, the decrease in aberrations was typically smaller in the treated animals. Thus, at the end of the lens-rearing period, higher than normal amounts of aberrations were observed in treated eyes, both hyperopic and myopic eyes and treated eyes that developed astigmatism, but not spherical ametropias. The total RMS wavefront error increased with the degree of spherical refractive error, but was not correlated with the degree of astigmatism. Both myopic and hyperopic treated eyes showed elevated amounts of coma and trefoil and the degree of trefoil increased with the degree of spherical ametropia. Myopic eyes also exhibited a much higher prevalence of positive spherical aberration than normal or treated hyperopic eyes. Following the onset of unrestricted vision, the amount of high-order aberrations decreased in the treated monkeys that also recovered from the experimentally induced refractive errors. Our results demonstrate that high-order aberrations are influenced by visual experience in young primates and that the increase in high-order aberrations in our treated monkeys appears to be an optical byproduct of the vision-induced alterations in ocular growth that underlie changes in refractive error. The results from our study suggest that the higher amounts of wave aberrations observed in ametropic humans are likely to be a consequence, rather than a cause, of abnormal refractive development.


Figures

Figure 1
Figure 1
Refractive error distributions for both eyes (filled bars = right eyes; open bars = left eyes) of (A) 26 normal control animals at ages corresponding to the end of the treatment period (mean = 143 ± 9 days) and (B) 38 treated monkeys at the end of the lens-rearing period (mean = 135 ± 17 days of age). The dashed vertical lines in (A) and (B) represent ± 2 standard deviations from the control group mean. (C) Vitreous chamber depth plotted as a function of spherical-equivalent refractive error for all normal (diamonds) and treated eyes (circles). The open and filled symbols represent left and right eyes, respectively. The solid line indicates the best fitting line determined by regression analysis for all the groups taken together.
Figure 2
Figure 2
Total RMS error (A), RMS coma (B), RMS trefoil (C), and the signed values for term Z40 (spherical aberration) (D) for the right and left eyes of individual normal and treated animals. The open circles represent the group means and the asterisks denote treated-group means that were significantly greater than the corresponding control-group mean (one-tailed, two-sample, t-test, P < 0.05).
Figure 3
Figure 3
Total RMS error (A), RMS coma (B), RMS trefoil (C) and spherical aberration (Zernike term Z40) (D) plotted as a function of the spherical-equivalent refractive error for myopic (circles), control (diamonds) and hyperopic groups (squares). The open and filled symbols represent data from right and left eyes, respectively. The solid lines represent linear fits for each group. The vertical dashed lines in each plot denote ± 2 standard deviations from the control group mean obtained at ages corresponding to the end of lens-rearing period.
Figure 4
Figure 4
Box plots of the Strehl ratios for the left and right eyes of the control animals, all of treated animals combined, and the myopic and hyperopic subgroups. The solid and dashed horizontal line inside each box denotes median and mean values, respectively. The edges of the box represent the 25th and 75th percentiles and the extended bars mark the 10th and 90th percentiles. The open circles denote data points that fall outside the 10th to 90th percentile limits. The asterisks (two-sample t-test) and plus symbols (one-way ANOVA and Tukey's pairwise comparisons) indicate that the mean values for a given group were significantly lower than that for the control eyes.
Figure 5
Figure 5
Box plots of refractive astigmatism (A) and total RMS errors (B) for the right and left eyes of the normal controls, the non-spherical ametropes, the myopes and the hyperopes. The solid and dashed horizontal line inside each box denotes median and mean values, respectively. The edges of the box represent the 25th and 75th percentiles and the extended bars mark the 10th and 90th percentiles. The open circles denote data points that fall outside the 10th to 90th percentile limits. The plus symbols denote group means that were significantly higher than those obtained for the normal controls (one-way ANOVA and Tukey's pairwise comparisons).
Figure 6
Figure 6
Spherical-equivalent refractive error (left), refractive astigmatism (middle) and total RMS error (right) plotted as a function of age for 4 representative treated animals that developed axial and astigmatic ametropias. The patterned area represents the 95% confidence intervals for the normal control eyes. The filled horizontal bars demark the lens-rearing period.
Figure 7
Figure 7
Mean (± 1 SE) total RMS errors plotted as a function of age for control monkeys (circles), treated monkeys that recovered from the experimentally induced refractive errors (triangles), and treated monkeys that did not show recovery from the experimentally induced axial errors. For the treated monkeys, the first and second data points represent values obtained at the start and end of the lens-rearing period.

References

    1. Artal P, Benito A, Tabernero J. The human eye is an example of robust optical design. Journal of Vision. 2006;6:1–7. http://journalofvision.org/6/1/1/ - PubMed
    1. Artal P, Guirao A, Berrio E, Williams DR. Compensation of corneal aberrations by the internal optics in the human eye. Journal of Vision. 2001;1:1–8. - PubMed
    1. Atchison DA. Anterior corneal and internal contributions to peripheral aberrations of human eyes. Journal of Optical Society of America A, Optics, Images, Science, and Vision. 2004;21:355–359. - PubMed
    1. Atchison DA, Pritchard N, Schmid KL, Scott DH, Jones CE, Pope JM. Shape of the retinal surface in emmetropia and myopia. Investigative Ophthalmology and Vision Science. 2005;46:2698–2707. - PubMed
    1. Bansal J, Coletta NJ, Moskowitz A, Han H. Pupil displacement in corneal topography images is related to the eye's refractive error. Investigative Ophthalmology and Vision Science. 2004;45(Suppl) ARVO E-Abstract nr 2762.

Publication types