

Feeding behavior, obesity, and neuroeconomics
- PMID: 17825853
- PMCID: PMC2259277
- DOI: 10.1016/j.physbeh.2007.08.003
Feeding behavior, obesity, and neuroeconomics
Abstract
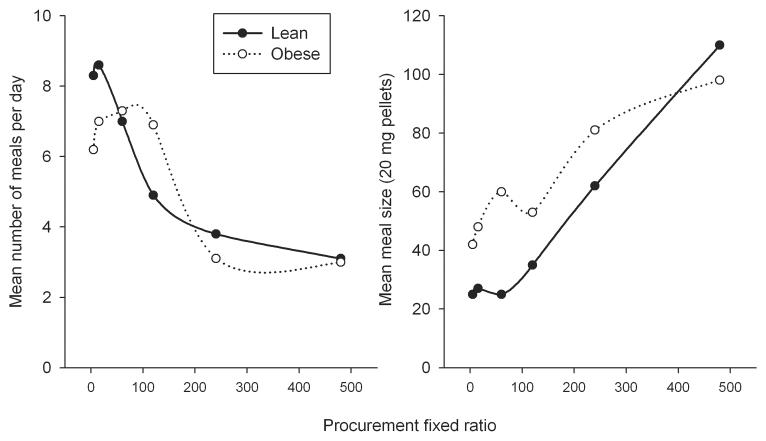
For the past 50 years, the most prevalent theoretical models for regulation of food intake have been based in the physiological concept of energy homeostasis. However, several authors have noted that the simplest form of homeostasis, stability, does not accurately reflect the actual state of affairs and most notably the recent upward trend in body mass index observed in the majority of affluent nations. The present review argues that processes of natural selection have more likely made us first and foremost behavioral opportunists that are adapted to uncertain environments, and that physiological homeostasis is subservient to that reality. Examples are presented from a variety of laboratory studies indicating that food intake is a function of the effort and/or time required to procure that food, and that economic decision-making is central to understanding how much and when organisms eat. The discipline of behavioral economics has developed concepts that are useful for this enterprise, and some of these are presented. Lastly, we present demonstrations in which genetic or physiologic investigations using environmental complexity will lead to more realistic ideas about how to understand and treat idiopathic human obesity. The fact is that humans are eating more and gaining weight in favorable food environments in exactly the way predicted from some of these models, and this has implications for the appropriate way to treat obesity.
Figures
Similar articles
-
Novel "thrifty" models of increased eating behaviour.Curr Psychiatry Rep. 2013 Nov;15(11):408. doi: 10.1007/s11920-013-0408-x. Curr Psychiatry Rep. 2013. PMID: 24057159 Review.
-
Appetite and energy balancing.Physiol Behav. 2016 Oct 1;164(Pt B):465-471. doi: 10.1016/j.physbeh.2016.03.038. Epub 2016 Apr 6. Physiol Behav. 2016. PMID: 27059321 Review.
-
Genetic and physiological factors in obesity.J La State Med Soc. 2005 Jan;157 Spec No 1:S12-8. J La State Med Soc. 2005. PMID: 15751905 Review.
-
Energy intake in weight-reduced humans.Brain Res. 2010 Sep 2;1350:95-102. doi: 10.1016/j.brainres.2010.05.062. Epub 2010 Jun 2. Brain Res. 2010. PMID: 20595050 Free PMC article. Review.
-
Development of eating behaviors among children and adolescents.Pediatrics. 1998 Mar;101(3 Pt 2):539-49. Pediatrics. 1998. PMID: 12224660 Review.
Cited by
-
Modeling the relationship between body weight and energy intake: a molecular diffusion-based approach.Biol Direct. 2012 Jun 29;7:19. doi: 10.1186/1745-6150-7-19. Biol Direct. 2012. PMID: 22742862 Free PMC article.
-
Costs of Foraging Predispose Animals to Obesity-Related Mortality when Food Is Constantly Abundant.PLoS One. 2015 Nov 6;10(11):e0141811. doi: 10.1371/journal.pone.0141811. eCollection 2015. PLoS One. 2015. PMID: 26545121 Free PMC article.
-
Reframing appetitive reinforcement learning and reward valuation as effects mediated by hippocampal-dependent behavioral inhibition.Nutr Res. 2020 Jul;79:1-12. doi: 10.1016/j.nutres.2020.05.001. Epub 2020 May 13. Nutr Res. 2020. PMID: 32544728 Free PMC article. Review.
-
Tonic dopamine modulates exploitation of reward learning.Front Behav Neurosci. 2010 Nov 4;4:170. doi: 10.3389/fnbeh.2010.00170. eCollection 2010. Front Behav Neurosci. 2010. PMID: 21120145 Free PMC article.
-
Cannabinoid-1 receptor antagonists reduce caloric intake by decreasing palatable diet selection in a novel dessert protocol in female rats.Am J Physiol Regul Integr Comp Physiol. 2008 Jul;295(1):R67-75. doi: 10.1152/ajpregu.00150.2008. Epub 2008 Apr 30. Am J Physiol Regul Integr Comp Physiol. 2008. PMID: 18448611 Free PMC article.
References
-
- Hill JO. Understanding and addressing the epidemic of obesity: an energy balance perspective. Endocr Rev. 2006;27:750–61. - PubMed
-
- Berthoud HR. Multiple neural systems controlling food intake and body weight. Neurosci Biobehav Rev. 2002;26:393–428. - PubMed
-
- Harris RBS. Role of set-point theory in regulation of body weight. FASEB J. 1990;4:3310–8. - PubMed
-
- Vogels N, Westerterp-Plantenga MS. Categorical strategies based on subject characteristics of dietary restraint and physical activity, for weight maintenance. Int J Obes. 2005;29:849–57. - PubMed
Publication types
MeSH terms
Grants and funding
LinkOut - more resources
Full Text Sources
Other Literature Sources
Medical
Miscellaneous
