. 2007 Dec 15;50(8):1027-40.
doi: 10.1016/j.toxicon.2007.07.010. Epub 2007 Jul 31.

Role of retinol in protecting epithelial cell damage induced by Clostridium difficile toxin A

Affiliations

Role of retinol in protecting epithelial cell damage induced by Clostridium difficile toxin A

Andressa A F L Maciel et al. Toxicon. .

Abstract

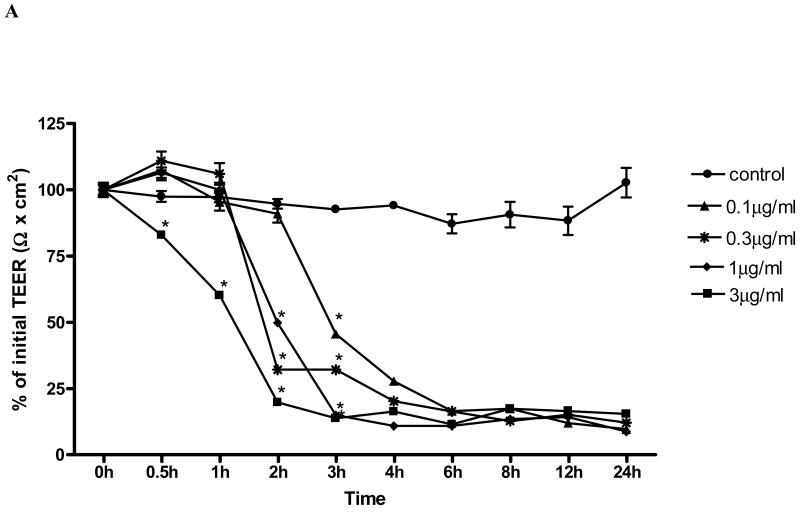
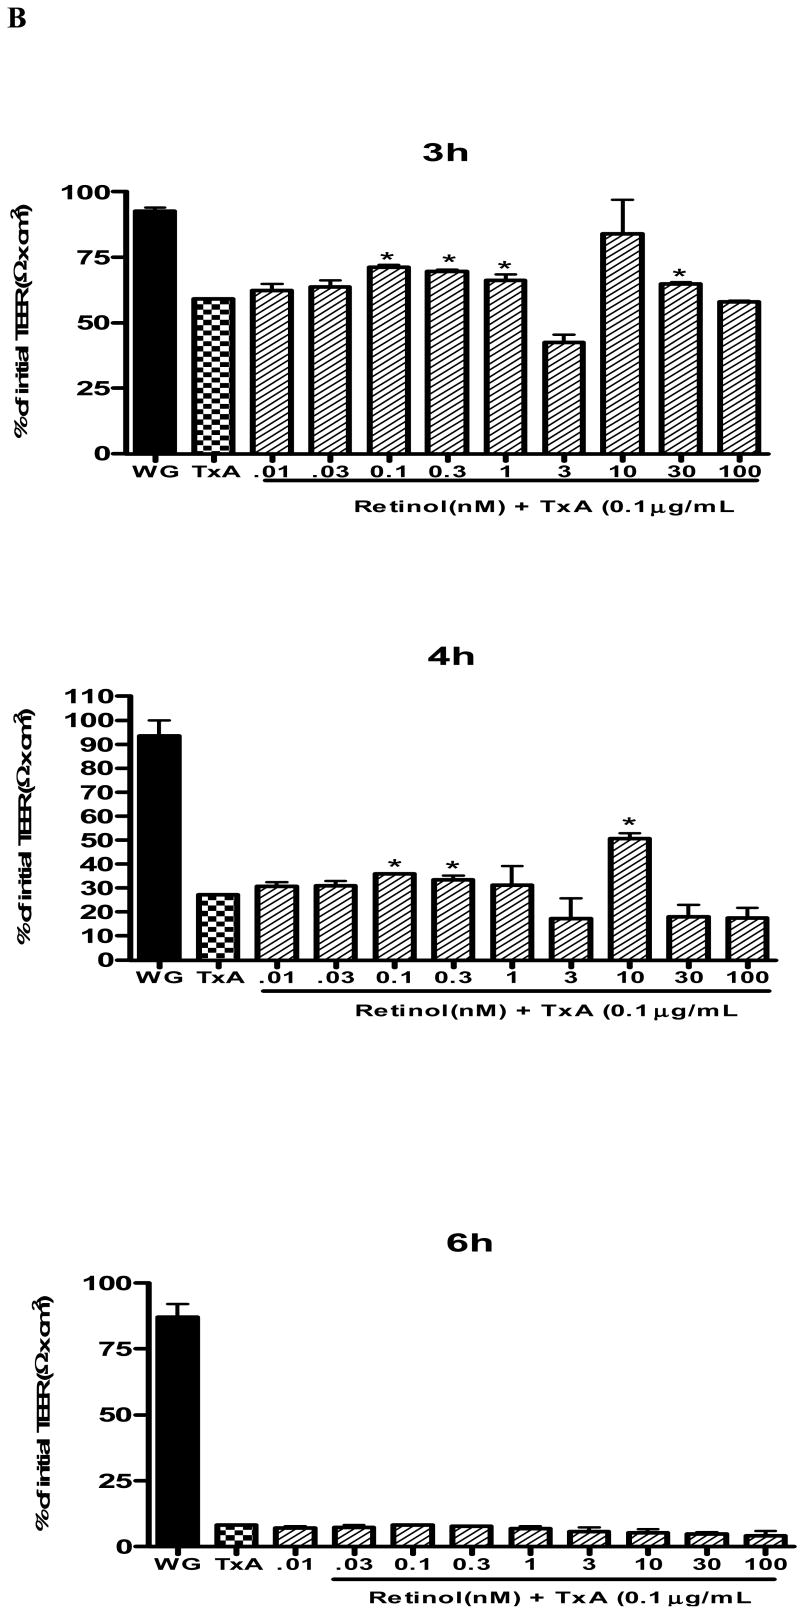
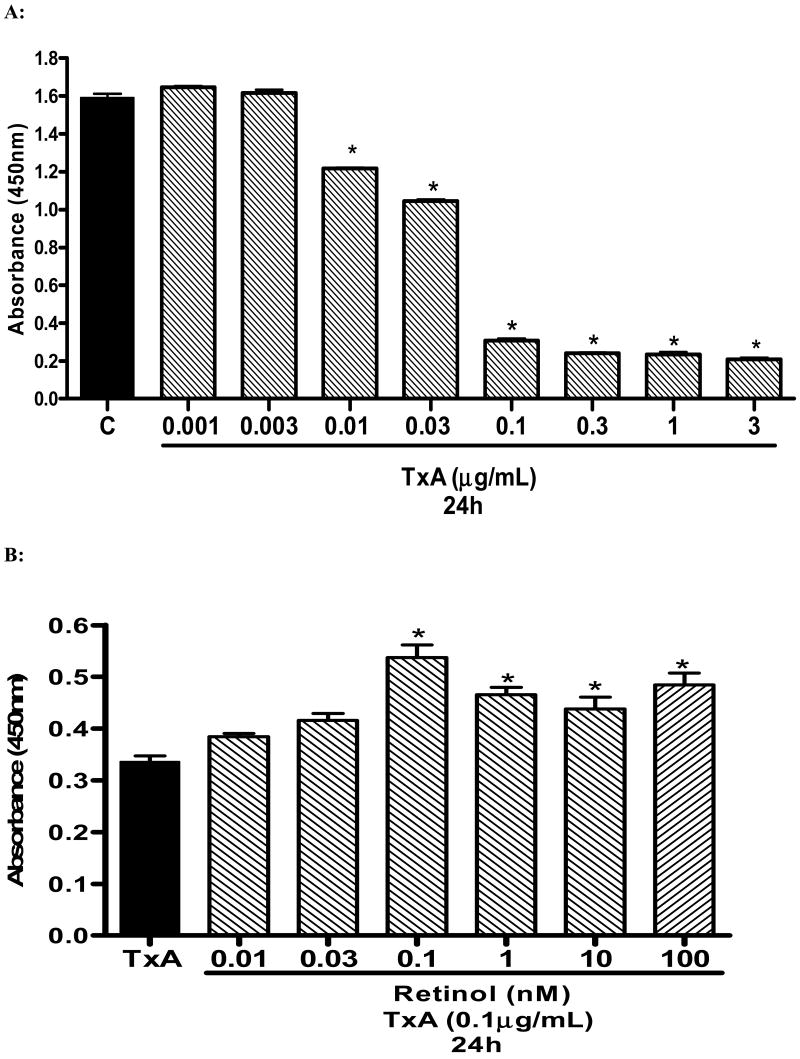
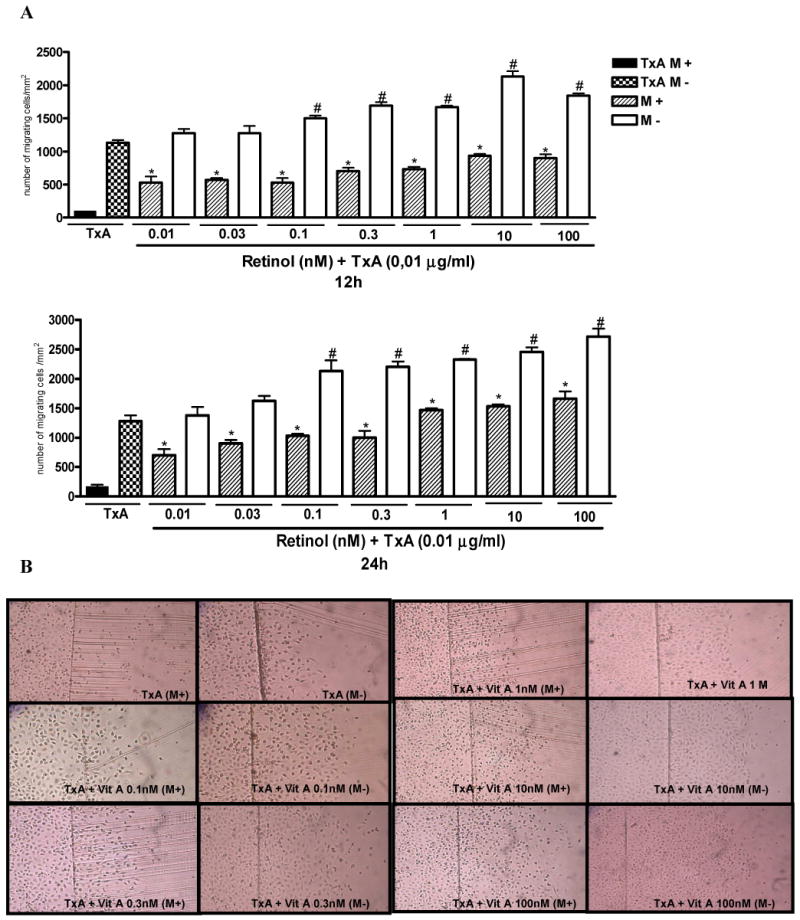
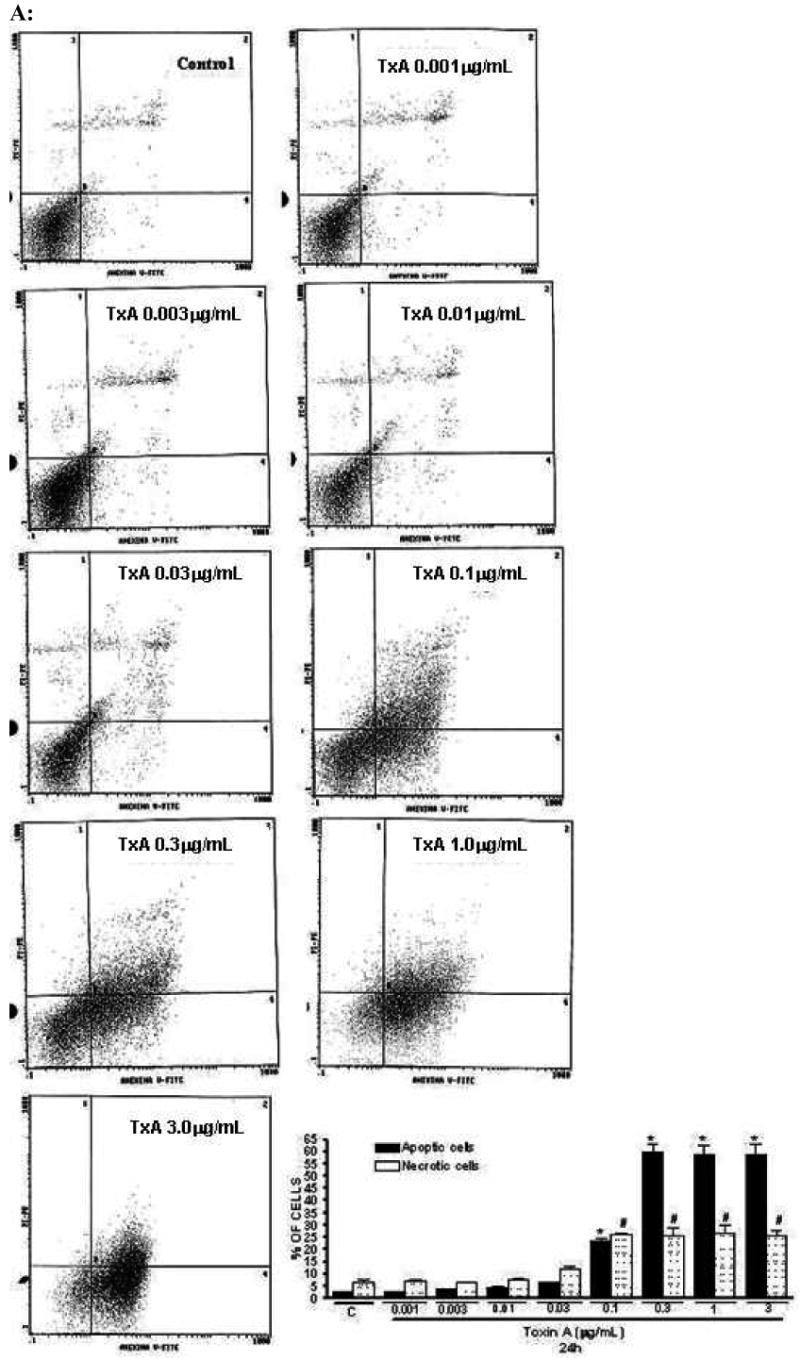
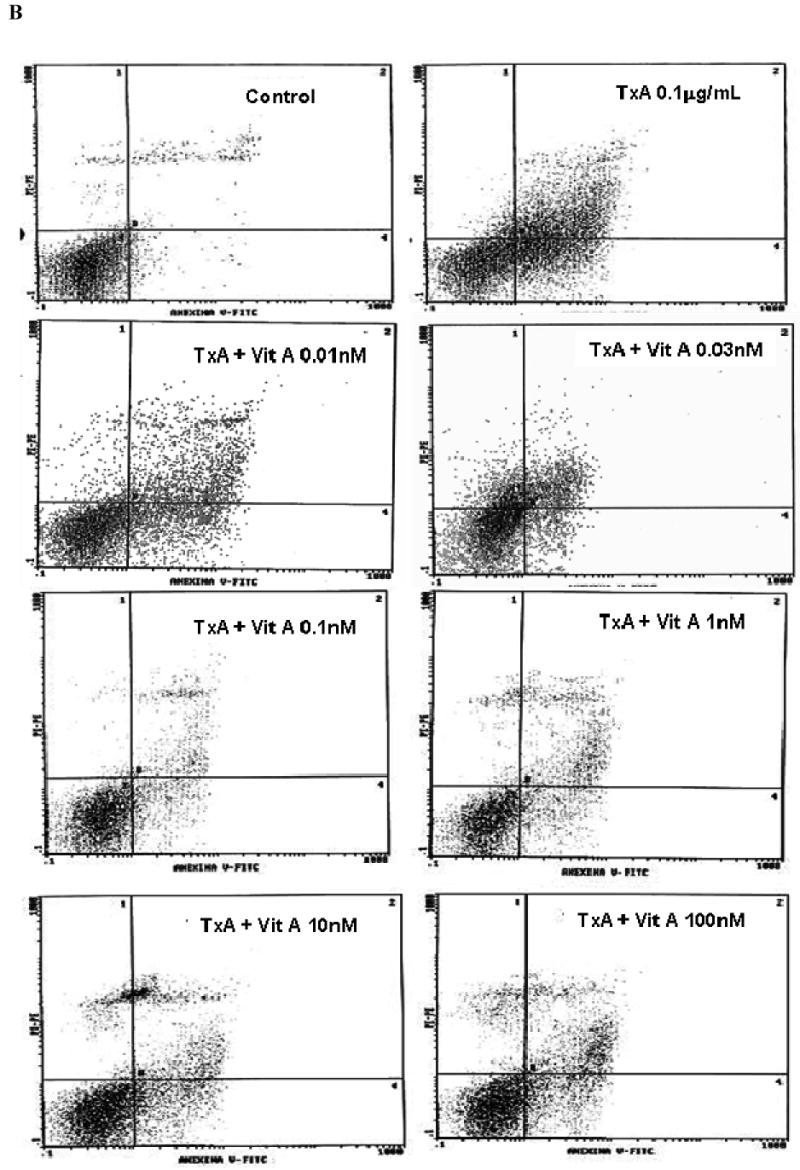
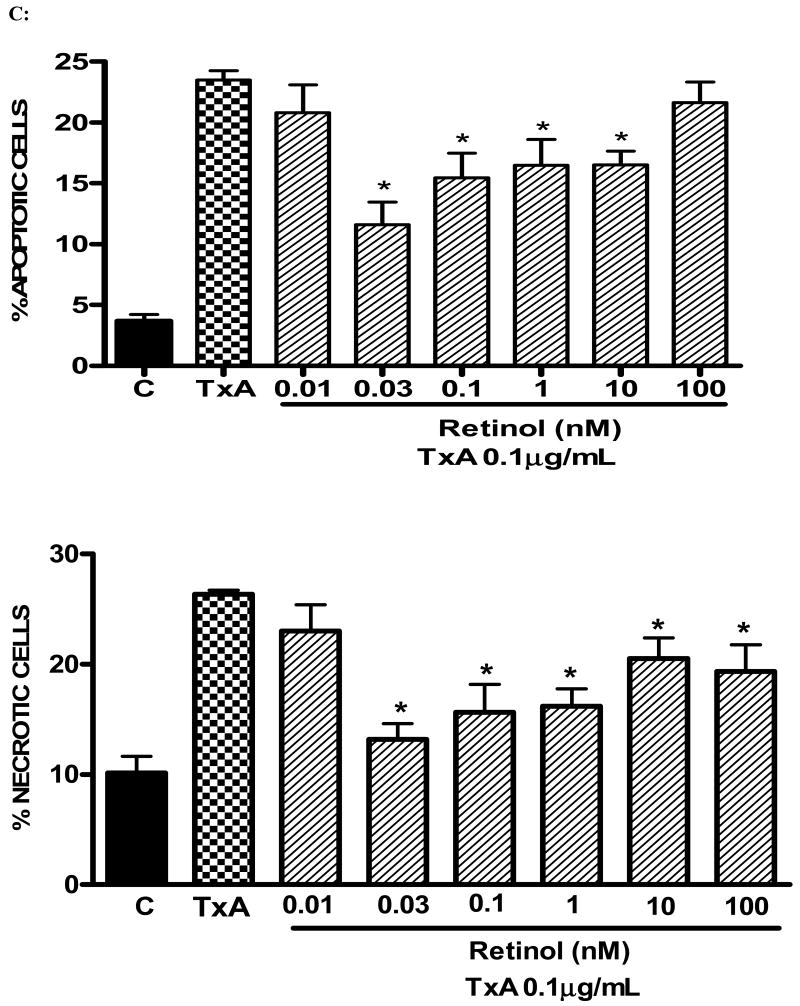
Vitamin A (retinol), a fat-soluble vitamin, is an essential nutrient for the normal functioning of the visual system, epithelial cell integrity and growth, immunity, and reproduction. Our group has investigated the effect of high doses of oral vitamin A on early childhood diarrhea in our prospective community-based studies from Northeast Brazil and found a beneficial role in reducing the mean duration but not incidence of diarrheal episodes. In this study, we explored the role of retinol supplementation in intestinal cell lines following Clostridium difficile toxin A (TxA) challenge. C. difficile is the most common anaerobic pathogen borne with antibiotic-borne diarrhea and pseudomembranous colitis. Since retinol is critical for the integrity of tight junctions and to modulate the cell cycle, we have focused on changes in transepithelial electrical resistance (TEER) in Caco-2, a more differentiated intestinal cell line, and on models of cell proliferation, migration and viability in IEC-6 cells, an undifferentiated crypt cell line, following TxA injury. In this model, retinol therapy reduced apoptosis, improved cell migration and proliferation, and prevented the reduction in TEER, following C. difficile TxA challenge in a glutamine-free medium. These results suggest the role of retinol in protecting intestinal epithelial barrier function from C. difficile TxA enterotoxic damage.


Figures

FIGURE 1
FIGURE 1
(A) C. difficile toxin A (TxA) (0.1-3μg/mL) effect on transepithelial electrical resistance (TEER) response after Caco-2 confluence. Caco-2 cells were grown on transwell-COL inserts in standard medium and were exposed to varying concentrations of TxA or sterile PBS vehicle (control). TEER was measured before, 30 minutes and until 24 hours after the addition of TxA. Values are means ± SEM. Statistical significance (P < 0.05) departure from the control is indicated by an asterisk, analyzed by ANOVA and Bonferroni's test. (B) Effect of retinol (0.01-100 nM) on Caco-2 monolayers' transepithelial electrical resistance (TEER) after C. difficile toxin A cell injury (0.1μg/mL). Transepithelial electrical resistance (TEER) was measured using Millicel Electrical Resistance System, by inserting electrodes into the apical and basal side of the well, according to the manufacturer's instructions. After cell confluence, TxA was added in the apical part, in a concentration of 0.1μg/mL. These cells were treated with different concentrations of retinol (0.01-100nM) and the control group received only deionized and sterile water as vehicle. Values are mean ± SEM. Statistical significance (P < 0.05) from the control is indicated by an asterisk, determined by Student's T test. Black bar represents TEER mean value from non-exposed Caco-2 cells seeded in a medium without glutamine (WG).
FIGURE 1
FIGURE 1
(A) C. difficile toxin A (TxA) (0.1-3μg/mL) effect on transepithelial electrical resistance (TEER) response after Caco-2 confluence. Caco-2 cells were grown on transwell-COL inserts in standard medium and were exposed to varying concentrations of TxA or sterile PBS vehicle (control). TEER was measured before, 30 minutes and until 24 hours after the addition of TxA. Values are means ± SEM. Statistical significance (P < 0.05) departure from the control is indicated by an asterisk, analyzed by ANOVA and Bonferroni's test. (B) Effect of retinol (0.01-100 nM) on Caco-2 monolayers' transepithelial electrical resistance (TEER) after C. difficile toxin A cell injury (0.1μg/mL). Transepithelial electrical resistance (TEER) was measured using Millicel Electrical Resistance System, by inserting electrodes into the apical and basal side of the well, according to the manufacturer's instructions. After cell confluence, TxA was added in the apical part, in a concentration of 0.1μg/mL. These cells were treated with different concentrations of retinol (0.01-100nM) and the control group received only deionized and sterile water as vehicle. Values are mean ± SEM. Statistical significance (P < 0.05) from the control is indicated by an asterisk, determined by Student's T test. Black bar represents TEER mean value from non-exposed Caco-2 cells seeded in a medium without glutamine (WG).
FIGURE 2
FIGURE 2
(A) Dose and time response of C. difficile toxin A (0.001-3μg/mL) exposure on IEC-6 cell proliferation following 24 hours, showing inhibition of cell proliferation in vitro. Cell proliferation assay was assessed by reading the absorbance using an ELISA microplate reader at 450nm in 96-well, following 24 hour of C. difficile toxin A exposure. After 24 hours, wells were incubated for 2 hours with 10μL of tetrazolium salt and the absorbance was measured. *P<0.05 compared with the control containing non-exposed IEC-6 cells seeded in a standard medium (C), by ANOVA and Bonferroni's test. (B) Effect of retinol (vit A) on cell proliferation assay by detected absorbance using an ELISA microplate reader at 450nm in 96-well seeded IEC-6 cells. Retinol (0.01-100nM) was diluted in medium without glutamine. After 24hours, wells were incubated for 2 hours with 10uL of the tetrazolium salt and the absorbance was measure at 24 hours. *P<0.05 compared to the non-treated and toxin A exposed control (TxA), by ANOVA and Bonferroni's test.
FIGURE 3
FIGURE 3
(A). Protective effect of retinol in IEC-6 cell migration following 12 and 24 hours of C. difficile toxin A (TxA) exposure (0.01μg/mL) with (M+) or without (M-) mitomycin C pretreatment (5μg/ml, 15-20 min prior to the scraping). IEC-6 cell monolayers were scraped and incubated with retinol (0.01-100nM) diluted in a glutamine-free medium, immediately after standard medium replacement. (B) Representative images of IEC-6 cell migration (X100) at 24 hours following TxA exposure (0.01μg/mL) and retinol supplementation (0.01-100nM) from 6-well plates with (M+) or without (M-) mitomycin C pretreatment. The bars represent mean ± SEM for the number of migrating cells per square millimeter of the scraped area. *P<0.05 compared to in cells incubated with TxA at 12 hours, #P<0.05, compared to in cells incubated with TxA at 24 hours, by ANOVA and Bonferroni's test.
FIGURE 4
FIGURE 4
(A) Apoptosis and necrosis induced by C. difficile toxin A (TxA) (0.001-3μg/mL) in a dose-dependent fashion at 24 hours. IEC-6 cells were incubated for 2 hours with TxA and then harvest. Cells were stained with FITC-conjugated annexin V and propidium iodide and analyzed by flow cytometry. Results are shown as density plots with propidium iodide vs. annexin V-FITC. Viable cells have low annexin-V-FITC and low propidium iodide staining (lower-left quadrant), apoptotic cells have high annexin V-FITC and low propidium iodide staining (lower-right quadrant), and necrotic cells have high propidium iodide and annexin V-FITC staining (upper-right quadrant). Bars on the graph (bottom right) represent the percentage of apoptotic and necrotic cells. (B) C. difficile toxin A-induced apoptosis and necrosis are inhibited by retinol (Vit A). IEC-6 cells were incubated for 24 hours with TxA (0.1μg/mL) in culture medium containing Vit A (0.01-100nM) or medium deprived of Vit A. Cells were stained with FITC-conjugated annexin V and propidium iodide and analyzed by flow cytometry. Results are shown as density plots with propidium iodide vs. annexin V-FITC. Viable cells have low annexin-V-FITC and low propidium iodide staining (lower-left quadrant), apoptotic cells have high annexin V-FITC and low propidium iodide staining (lower-right quadrant), and necrotic cells have high propidium iodide and annexin V-FITC staining (upper-right quadrant). (C) C. difficile toxin A-induced apoptosis and necrosis are inhibited by retinol (Vit A). IEC-6 cells were incubated for 24 hours with TxA (0.1μg/mL) in culture medium containing Vit A (0.01-100nM) or medium deprived of Vit A. Bars on the graph represent the percentage of apoptotic and necrotic cells (C). *P<0.05 compared to media with TxA by ANOVA and Bonferroni's test.
FIGURE 4
FIGURE 4
(A) Apoptosis and necrosis induced by C. difficile toxin A (TxA) (0.001-3μg/mL) in a dose-dependent fashion at 24 hours. IEC-6 cells were incubated for 2 hours with TxA and then harvest. Cells were stained with FITC-conjugated annexin V and propidium iodide and analyzed by flow cytometry. Results are shown as density plots with propidium iodide vs. annexin V-FITC. Viable cells have low annexin-V-FITC and low propidium iodide staining (lower-left quadrant), apoptotic cells have high annexin V-FITC and low propidium iodide staining (lower-right quadrant), and necrotic cells have high propidium iodide and annexin V-FITC staining (upper-right quadrant). Bars on the graph (bottom right) represent the percentage of apoptotic and necrotic cells. (B) C. difficile toxin A-induced apoptosis and necrosis are inhibited by retinol (Vit A). IEC-6 cells were incubated for 24 hours with TxA (0.1μg/mL) in culture medium containing Vit A (0.01-100nM) or medium deprived of Vit A. Cells were stained with FITC-conjugated annexin V and propidium iodide and analyzed by flow cytometry. Results are shown as density plots with propidium iodide vs. annexin V-FITC. Viable cells have low annexin-V-FITC and low propidium iodide staining (lower-left quadrant), apoptotic cells have high annexin V-FITC and low propidium iodide staining (lower-right quadrant), and necrotic cells have high propidium iodide and annexin V-FITC staining (upper-right quadrant). (C) C. difficile toxin A-induced apoptosis and necrosis are inhibited by retinol (Vit A). IEC-6 cells were incubated for 24 hours with TxA (0.1μg/mL) in culture medium containing Vit A (0.01-100nM) or medium deprived of Vit A. Bars on the graph represent the percentage of apoptotic and necrotic cells (C). *P<0.05 compared to media with TxA by ANOVA and Bonferroni's test.

Similar articles

Cited by

References

    1. Baltes S, Nau H, Lampen A. All-trans retinoic acid enhances differentiation and influences permeability of intestinal Caco-2 cells under serum-free conditions. Dev Growth Differ. 2004;46(6):503–514. - PubMed
    1. Barreto ML, Santos LM, Assis AM, Araujo MP, Farenzena GG, Santos PA, Fiaccone RL. Effect of vitamin A supplementation on diarrhoea and acute lower-respiratory-tract infections in young children in Brazil. Lancet. 1994;344(8917):228–231. - PubMed
    1. Bartlett JG, Taylor NS, Chang T, Dzink J. Clinical and laboratory observations in Clostridium difficile colitis. Am J Clin Nutr. 1980;33 11:2521–2526. - PubMed
    1. Beyzadeoglu M, Balkan M, Demiriz M, Tibet H, Dirican B, Oner K, Pak Y. Protective effect of vitamin A on acute radiation injury in the small intestine. Radiat Med. 1997;15(1):1–5. - PubMed
    1. Blomhoff R, Blomhoff HK. Overview of retinoid metabolism and function. J Neurobiol. 2006;66(7):606–630. - PubMed

Publication types