Review
. 2007 Aug;17(3):285-301, vii.
doi: 10.1016/j.nic.2007.03.006.

Pathology of atherosclerosis and stenting

Affiliations
Review

Pathology of atherosclerosis and stenting

Frank D Kolodgie et al. Neuroimaging Clin N Am. 2007 Aug.

Abstract

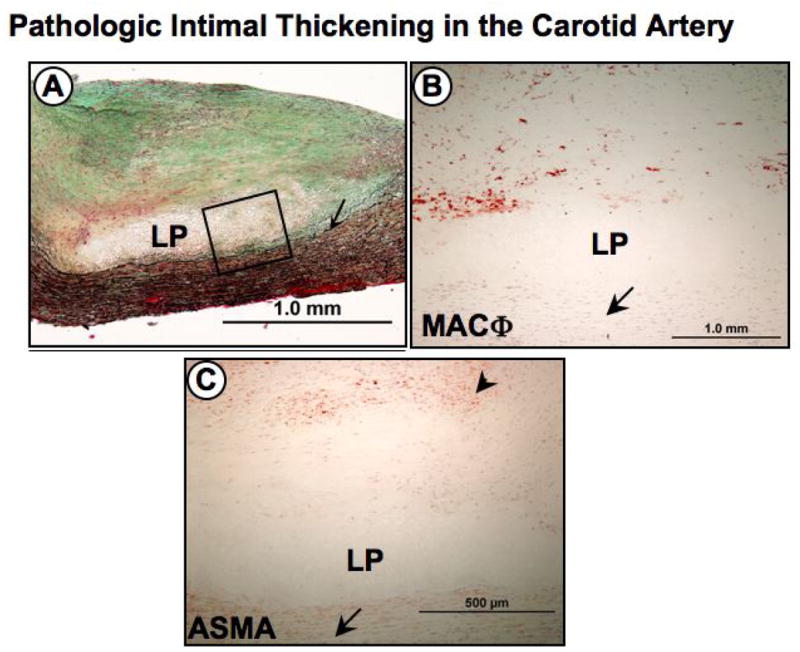
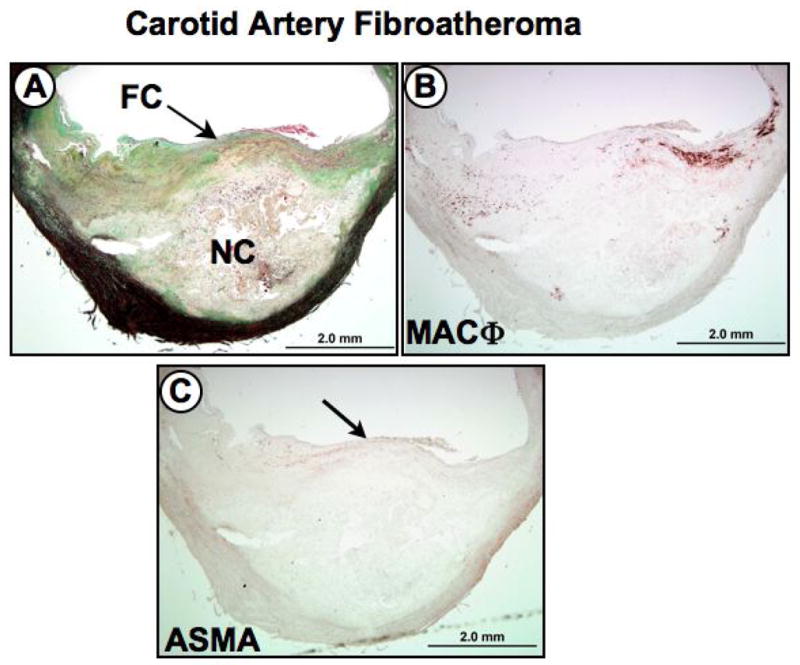
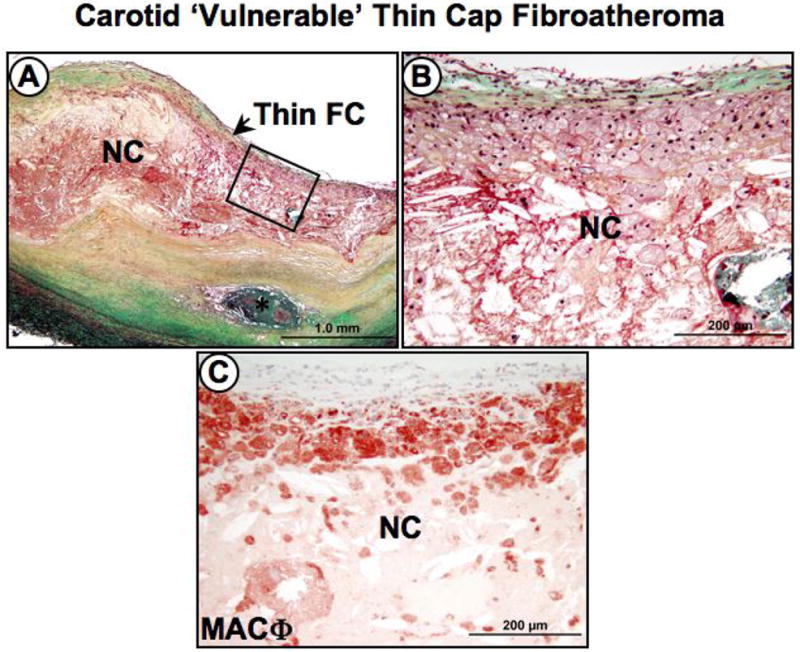
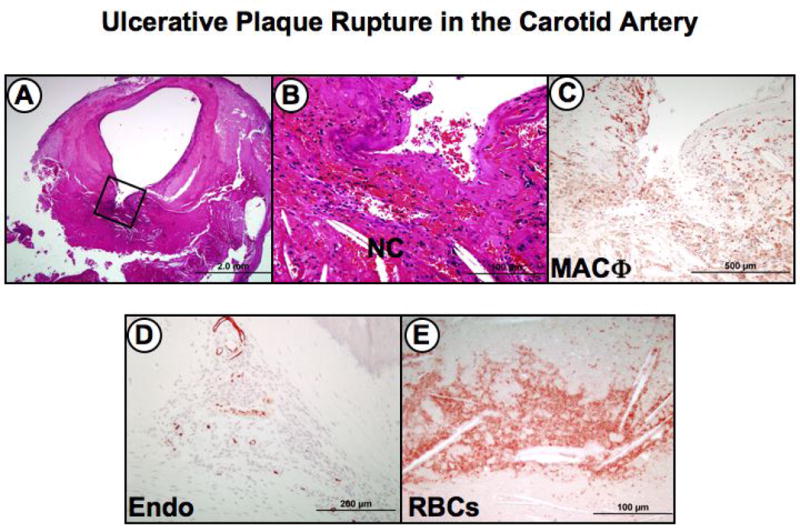
Atherosclerotic plaque at the carotid bifurcation is the primary cause of ischemic strokes and the degree of carotid stenosis is strongly associated with stroke risk in symptomatic patients. Stroke is the third-leading cause of death in the United States, constituting approximately 700,000 cases each year. In this article, the authors discuss the natural history of carotid and intracranial atherosclerosis, based on their broader knowledge of coronary atherosclerosis. Early to more advanced progressive lesions of the carotid are categorized, based on descriptive morphologic events originally cited for the coronary circulation. The histologic features associated with symptomatic and asymptomatic carotid disease are also addressed, along with the issues surrounding current stent-based therapies for the prevention of major recurrent vascular events.


Figures

Figure 1
Figure 1. Pathologic intimal thickening (PIT) in the carotid artery
PITs are considered progressive early lesions to the more advanced fibroatheroma, or plaques with true necrotic cores. Panel A, shows a low power image of an eccentric carotid plaque with a relatively acellular lipid pool (LP) near the medial wall (arrow). Note the absence of necrosis. Panel B, is a higher power image representing the region within the black box in A showing an absence of cells within a lipid pool with surrounding CD-68 positive macrophages (MACΦ) more towards the lumen (arrow indicates medial wall). Infiltration of superficial macrophage into the lipid pool may cause conversion to the more advanced fibroatheroma. Panel C, anti-α-smooth muscle cell actin (ASMA) immunostaining show a distribution of smooth muscle cells (arrowhead) more towards the lumen while the lipid pool (LP) is adjacent to the medial wall (arrow).
Figure 2
Figure 2. Serial sections of a carotid artery fibroatheroma
Panel A (Movat Pentachrome stain), shows an eccentric plaque with a relatively large necrotic core (NC) covered by a thick fibrous cap (FC). Panel B, shows a dense region of CD68-positive macrophages in the shoulder region of the plaque. Panel C, anti-α-smooth muscle cell actin (ASMA) immunostaining revealing a paucity of smooth muscle cells within the fibrous cap (arrow).
Figure 3
Figure 3. Thin cap fiboratheroma ‘vulnerable’ plaque in a carotid endarterectomy specimen
Panel A, low power image shows a carotid plaque with a relatively larger necrotic core (NC) covered by a thin fibrous cap (FC). An area of calcified necrotic core (*) is seen in the deeper intimal layers. Panel B, higher power image of an area represented by the black box in A showing the necrotic core and thin fibrous cap infiltrated by foam cells. Panel C, numerous CD-68 positive macrophages (MACΦ) are seen infiltrating the fibrous cap. Panels A and B show Movat Pentachrome staining.
Figure 4
Figure 4. Serial sections of plaque rupture with ulceration in a carotid endarterectomy specimen
This lesion is the most frequent finding in patients with symptomatic carotid disease. Panel A, the low power image shows a disrupted fibrous cap with a relatively large excavated necrotic core (boxed area). Note the absence of a significant luminal thrombus. Panel B, higher power view of the area represented by the black box in A, showing the excavated necrotic core with recent hemorrhage and cholesterol clefts. Panel C, numerous CD-68 positive macrophages (MACΦ) are seen infiltrating the fibrous cap and surrounding necrotic core. Panel D, Immunostaining with the endothelial marker Ulex europaeus lectin showing intraplaque neovascularization in the plaque shoulder near the necrotic core. Panel E, old intraplaque hemorrhage in an deep area of the necrotic core rich in free cholesterol (clefts) as visualized by anti-glycophorin A immunostaining. Panels A and B, hematoxylin and eosin staining.
Figure 5
Figure 5. Eruptive and non-eruptive nodular calcification in carotid atherosclerosis
Panel A, the low power image of a carotid endarterectomy specimen shows extensive calcification represented by larger plates (*) and multiple smaller nodules (arrowheads). Panel B, higher power image of area represented by the black box in A, showing eruptive nodular calcification (CN) with a luminal thrombus (Th). Panel C, shows nodular calcification near the luminal surface without a luminal thrombus. Panel D, the higher power view shows an osteoclast-like cell, which is frequently associated with nodular calcification. Panels A to D hematoxylin and eosin stains.
Figure 6
Figure 6. Bare metal stent in coronary artery at 7 months after implantation
Panel A, the radiograph of the explanted stent shows severe calcification of the arterial segment evidenced by the hyper-dense areas. Panel B, a cross section of middle portion of the stent showing a widely patent lumen with all struts are covered by neointimal growth. Panels C and D, higher magnifications of the regions represented by the respective black boxes in B showing a neointima composed primarily of smooth muscle cells and proteoglycans (bluish-greeen on Movat pentachrome) with neoangiogenesis (arrows). Panels B to D, Movat Pentachrome staining.
Figure 7
Figure 7. Drug-eluting coronary Cypher stent at 4 months after implantation
Panel A, shows a radiograph of a well-expanded Cypher stent. Panel B, the cross sectional image shows minimal neointimal coverage over stent struts. Panels C and D, higher magnifications of the regions represented by the respective black boxes in B showing inflammatory cells around stent struts consisting of giant cells (*), lymphocytes (inset in panel C), and eosinophils (inset in panel D, arrows). Panels B to C are Movat Pentachrome stains, the insets are hematoxylin and eosin.
Figure 8
Figure 8. Drug-eluting coronary Taxusstent at 7 months after implantation
Panel A, the radiograph shows a Taxus stent in a tortuous and calcified vessel. Panel B, the cross sectional image shows minimal neointimal coverage over stent struts. Panels C and D, higher magnifications of the regions represented by the respective black boxes in B, note the persistent fibrin accumulated around stent struts (arrowheads) together with chronic inflammatory cells of mainly, lymphocytes (arrows).
Figure 9
Figure 9. Carotid artery stent seven years after implantation
Panel A, the radiograph shows a pair of similar overlapping stents with tranverse sections taken for histology from the proximal non-overlap (slice B) and middle overlaping (slice D) region. Panel B, a cross sectional image from proximal regions of the stents shows a widely patent lumen. Panel C, Higher magnification represented by the region within the black box in B showing accumulated fibrin around stent struts. Panels D and E, are low and higher power cross sectional images at a site of strut overlap. Several stent struts remain poorly covered by neointimal growth and are surrounded by a non-occlusive, non-flow limiting fibrin-rich thrombus (*).
Figure 10
Figure 10. Carotid artery stents eight- (panels A to C) and ten- (panels D to F) months after implantation
Panel A, radiograph of an eight month stented carotid segment with focal calcification. Panel B, the cross sectional image at the carotid bifurcation shows an occlusive thrombus with stent struts remaining uncovered by neointimal growth (arrows). Panel C, the higher power image represented by the area within the black box in B shows a tear in the arterial wall at ostium of the side branch with a superimposed thrombus. Panel D, radiographic image of a 10-month carotid stent implant in an arterial segment with focal areas of dense calcification. Panel E, histologic image showing severe restenosis with approximately 80% cross-sectional luminal narrowing, a postmortem clot (asterisk) is seen in the lumen. Panel F, a higher power image within the black box in E showing chronic inflammation and angiogenesis around stent struts.

Similar articles

Cited by

References

    1. North American Symptomatic Carotid Endarterectomy Trial Collaborators N. Beneficial effect of carotid endarterectomy in symptomatic patients with high-grade carotid stenosis. N Engl J Med. 1991;325:445–453. - PubMed
    1. Thom T, Haase N, Rosamond W, Howard VJ, Rumsfeld J, Manolio T, Zheng ZJ, Flegal K, O'Donnell C, Kittner S, Lloyd-Jones D, Goff DC, Jr, Hong Y, Adams R, Friday G, Furie K, Gorelick P, Kissela B, Marler J, Meigs J, Roger V, Sidney S, Sorlie P, Steinberger J, Wasserthiel-Smoller S, Wilson M, Wolf P. Heart disease and stroke statistics--2006 update: a report from the American Heart Association Statistics Committee and Stroke Statistics Subcommittee. Circulation. 2006;113:e85–151. - PubMed
    1. Carr S, Farb A, Pearce WH, Virmani R, Yao JS. Atherosclerotic plaque rupture in symptomatic carotid artery stenosis. J Vasc Surg. 1996;23:755–765. discussion 765–756. - PubMed
    1. Spagnoli LG, Mauriello A, Sangiorgi G, Fratoni S, Bonanno E, Schwartz RS, Piepgras DG, Pistolese R, Ippoliti A, Holmes DR., Jr Extracranial thrombotically active carotid plaque as a risk factor for ischemic stroke. Jama. 2004;292:1845–1852. - PubMed
    1. Gronholdt ML, Nordestgaard BG, Schroeder TV, Vorstrup S, Sillesen H. Ultrasonic echolucent carotid plaques predict future strokes. Circulation. 2001;104:68–73. - PubMed

MeSH terms