Review
. 2007 Oct;16(5):335-48.
doi: 10.1016/j.hlc.2007.07.005. Epub 2007 Sep 10.

Normal heart rhythm is initiated and regulated by an intracellular calcium clock within pacemaker cells

Affiliations
Review

Normal heart rhythm is initiated and regulated by an intracellular calcium clock within pacemaker cells

Victor A Maltsev et al. Heart Lung Circ. 2007 Oct.

Abstract

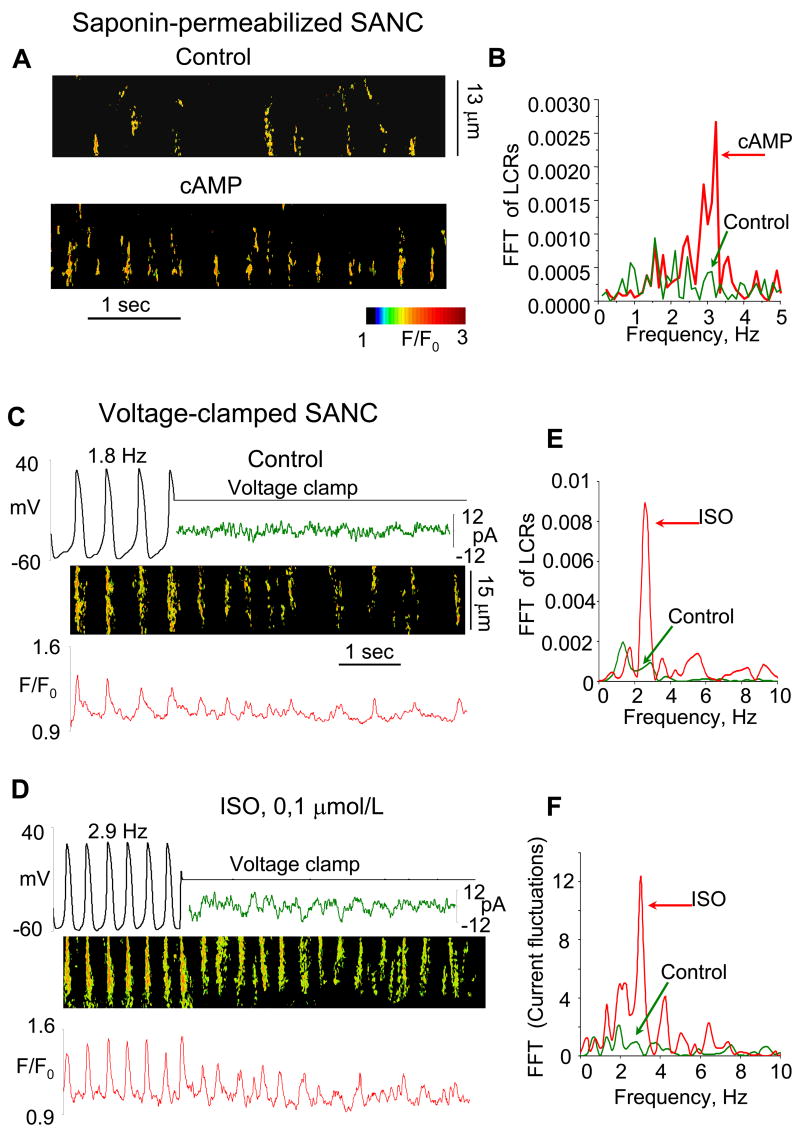
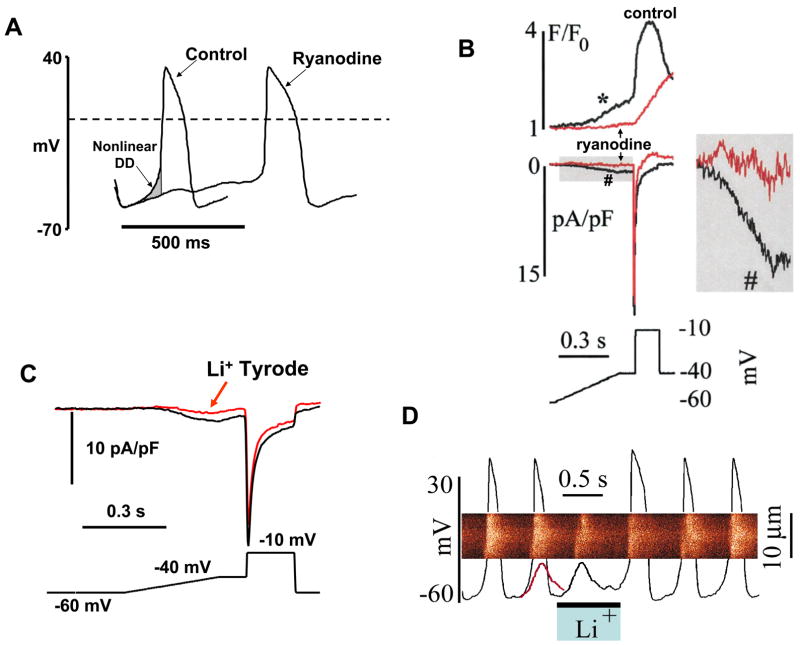
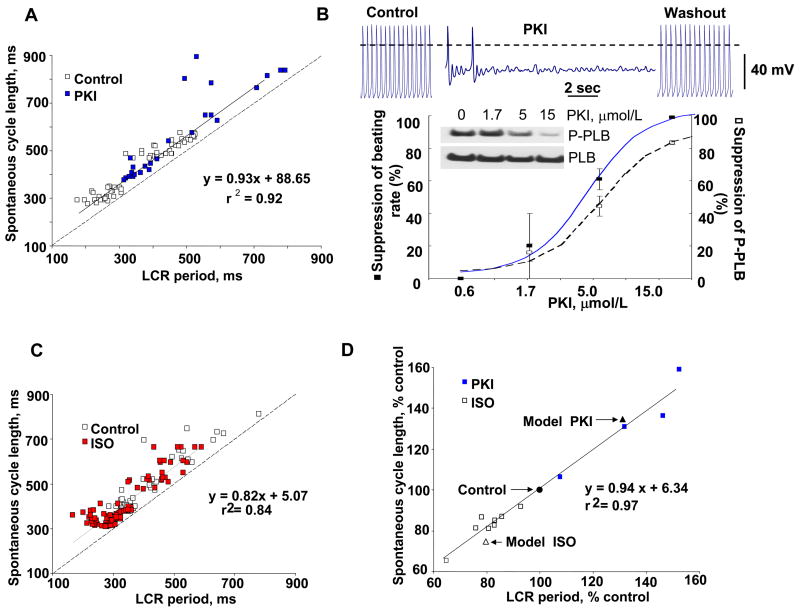
For almost half a century it has been thought that the heart rhythm originates on the surface membrane of the cardiac pacemaker cells and is driven by voltage-gated ion channels (membrane clocks). Data from several recent studies, however, conclusively show that the rhythm is initiated, sustained, and regulated by oscillatory Ca(2+) releases (Ca(2+) clock) from the sarcoplasmic reticulum, a major Ca(2+) store within sinoatrial node cells, the primary heart's pacemakers. Activation of the local oscillatory Ca(2+) releases is independent of membrane depolarisation and driven by a high level of basal state phosphorylation of Ca(2+) cycling proteins. The releases produce Ca(2+) wavelets under the cell surface membrane during the later phase of diastolic depolarisation and activate the forward mode of Na(+)/Ca(2+) exchanger resulting in inward membrane current, which ignites an action potential. Phosphorylation-dependent gradation of speed at which Ca(2+) clock cycles is the essential regulatory mechanism of normal pacemaker rate and rhythm. The robust regulation of pacemaker function is insured by tight integration of Ca(2+) and membrane clocks: the action potential shape and ion fluxes are tuned by membrane clocks to sustain operation of the Ca(2+) clock which produces timely and powerful ignition of the membrane clocks to effect action potentials.


Figures

Figure 1
Figure 1
A: Schematic representation of the idea that Ca2+ clock ignites ion channel membrane clocks to entrain normal automaticity in cardiac pacemaker cells (see text for details). B: A schematic illustration of the fine structure of the diastolic depolarization (DD) following of spontaneous action potential in rabbit SANC shown together with inward ion currents and related Ca2+ signals. The nonlinear, exponentially rising, late DD part is shown as a gray area between membrane potential curve and an extrapolation of the initial, linear DD part (modified from [37]). C,D: Confocal line scan images of Ca2+ signals (Fluo-3) measured in rabbit SANC with different orientation of the scanning line. Trace in panel C is simultaneous action potential recordings in perforated patch clamp configuration. Trace in panel D is the time course of the average Ca2+ signal along the scan line. Local Ca2+ Releases (shown by white arrows) occur under cell surface membrane in the later part of diastolic depolarization. Modified from [14].
Figure 2
Figure 2
Suppression of cAMP-mediated, PKA-dependent signaling in SANC decreases frequency and size of LCRs in permeabilized and intact SANC. A: Confocal linescan images of a representative saponin-permeabilized SANC bathed in 100 nmol/L free [Ca2+] before (top), and after (bottom) superfusion with 15 μM PKI, a specific peptide inhibitor of PKA catalytic submit. B: The average frequency (normalized per 1 s and 100 μm and size of LCR in skinned SANC in control conditions (72 LCR, n = 4) and 15 μM PKI (20 LCR).*P < 0.05. Error bars indicate standard error of mean. C and D: Simultaneous recordings of membrane potential or current (top), confocal linescan image (middle), and normalized fluo-3 fluorescence (bottom) averaged over the linescan image, in a representative spontaneously beating SANC with intact sarcolemma before and during voltage clamp to −10 mV in control (C) and following PKA inhibition (8 μM PKI) (D). Fast Fourier transform (FFT) of Ca2+ (E) and membrane current (F) fluctuations during voltage clamp in control and after PKI. Because current fluctuations during voltage clamp were imposed on the total membrane current, each data set was fit with a nonlinear regression line that was subtracted to give a difference signal to minimize frequency interference. From [5].
Figure 3
Figure 3
Stimulation of cAMP-mediated, PKA-dependent signaling in SANC increases internal Ca2+ oscillation frequency. A: Confocal linescan images of a representative saponin-skinned SANC bathed in 100 nM [Ca2+], before (top), and after (bottom) superfusion with 10 μM cAMP. B: Fast Fourier transform (FFT) of Ca2+ fluctuations of the cell in panel A in control conditions and during superfusion with cAMP. C and D: Simultaneous recordings of membrane potential or current (top), linescan image (middle), and normalized fluo-3 fluorescence (bottom) averaged over the linescan image, in a representative spontaneously beating cell with intact sarcolemma before and during voltage clamp to −10 mV in control (C) and following exposure to a β-AR agonist (0.1 μM isoproterenol, ISO) (D). E and F: FFT of Ca2+ (E) and membrane current fluctuations (F) during voltage clamp in control and after ISO. From [5].
Figure 4
Figure 4
Local Ca2+ releases persist during spontaneous beating and under voltage clamp to -70 mV, when T-type Ca2+ current is blocked by Ni2+ in rabbit SANC. A: recordings of APs (top), line-scan image (middle) and normalized subsarcolemmal fluorescence averaged spatially over the image width in a representative SANC during superfusion with 50 μM Ni2+. B: control recordings of line-scan image and normalized subsarcolemmal fluorescence in the same cell before exposure to Ni2+. From [10].
Figure 5
Figure 5
High basal level of cAMP and cAMP-mediated, PKA-dependent phospholamban (PLB) phosphorylation in SANC. A: Average content of cAMP in suspensions of SANC, atrial or ventricular myocytes, and changes in cAMP level in SANC following suppression of adenylyl cyclase activity with 400 μM MDL (an adenylyl cyclase inhibitor) or β-AR stimulation (1 μM isoproterenol, ISO). B: Left, Western blots of the basal level of phosphorylated at serine16 (P-PLB) and total PLB in SANC and ventricular myocytes; right, average values of phosphorylated PLB normalized to total PLB. C: Phosphorylated PLB and total PLB at base line and in response to graded increases inAC inhibition by MDL (note that the concentration of MDL increases from right to left). D: Typical Western blots of the basal level of PLB phosphorylation and that following PKA inhibition (15 μM PKI, a specific peptide inhibitor of PKA catalytic subunit), or β-AR stimulation (1 μM ISO). E: Average changes in phosphorylated PLB induced by maneuvers in (C and D) (MDL concentration was 400 μM). *P < 0.05. Error bars indicate standard error of means. From [5].
Figure 6
Figure 6
Local Ca2+ releases (LCRs) ignite rhythmic APs via activation of NCX current imparting an exponential increase to the later part of the diastolic depolarization (“nonlinear DD”) in rabbit SANC. A: Ryanodine abolishes the LCR-mediated AP ignition early in the cycle by inhibition of the nonlinear DD (gray area shown by arrow). Modified from [22]. B: Ryanodine (3 μM, 4 min) inhibits submembrane Ca2+ increase (*) and inward current (#) during a simulated diastolic depolarization (bottom) without affecting peak ICaL. Inset shows the indicated part of the current record at greater magnification. C: An inhibitory effect of a 10s Na+-free spritz (arrow) on inward current during the voltage ramp protocol (bottom). D: Linescan image of Ca2+ release with superimposed AP records during rapid and brief superfusion with a solution in which Na+ was replaced by Li+. Note that the maneuver blocked the subsequent AP firing. The line superimposed on the last AP preceding spritz of Na+-free solution is a copy of the residual membrane potential oscillation observed during the Li+ solution spritz. From [7].
Figure 7
Figure 7
Membrane potential fluctuations resulting from LCRs in rabbit SANC impart an exponential phase to the late DD that controls their chronotropic state. A: Schematic illustration of the assessment of the non-linear DD component (NDDC). B: Eight successive APs with seven 90-ms recordings of DD marked. C: Superimposition of 7 individual DDs marked in B and their mean (bold). D: Residual voltage after subtracting the mean of a group records from 7 successive DDs. Note the larger beat-to-beat deviations as the DD approaches the AP upstroke. E: Time course of DD variance (curve) and of the relative LCR occurrences (columns) observed at different times before AP upstroke (166 measurements in 24 cells under control conditions). F: Changes in DD fluctuations and NDDC amplitude versus changes in beating rate with respect to chronotropic interventions. From [20].
Figure 8
Figure 8
A: Schematic illustration of functional integration and regulation of membrane and submembrane Ca2+ cycling to control pacemaker function via NCX-mediated ignition of rhythmic APs. The thick line indicates spontaneous SR Ca2+ cycling (see text for details). Modified from [5]. B: Spontaneous beating of rabbit SANC critically depends upon Ca2+-related mechanisms and protein phosphorylation. Bars show a decrease in the beating rate (% control) induced by different drugs that affect Ca2+ cycling [ryanodine (Ry), BAPTA-AM], NCX (Li+ substitution for Na+), protein phosphorylation (PKI, H-89, MDL), or ion channels: If (Cs+) or T-type Ca2+ current (Ni2+). PKI and H-89 are protein kinase A inhibitors, and MDL is an adenylyl cyclase inhibitor. From [22]. C: Disabling RyR markedly reduces the stimulatory effects of CPT-cAMP on the spontaneous beating rate of rabbit SANC. Left panel: typical examples of the change in the spontaneous beating rate of rabbit SANC in response to CTP-cAMP, before and after exposure to ryanodine; right panel: the average effects; error bars indicate standard error of mean, * P<0.05. From [5].
Figure 9
Figure 9
Suppression (PKI, a specific inhibitor of PKA, 14–22 amide) or stimulation (isoproterenol, ISO) of PKA-dependent phosphorylation have opposite effects on frequency and spatio-temporal properties of LCRs in intact, spontaneously firing rabbit SANC. A: Confocal linescan images of a representative nodal cells depicting AP-induced Ca2+ transients and LCRs during spontaneous beating in control and when PKA phosphorylation was inhibited by PKI or stimulated by ISO. B and C: Histograms of LCR period and size (full width at half maximum) in control (n = 4 cells, 58 LCRs) and after superfusion with 5 μM PKI (n=4 cells, 25 LCRs). D and E: Histograms of LCR period and size in control (8 cells, 42 LCRs) and after superfusion with 0.1 μM ISO (8 cells, 89 LCRs). From [5]
Figure 10
Figure 10
A: The PKI effect to increase the spontaneous cycle length is linked to its effect on the LCR period. Note that this relationship lies above the line of identity (dashed line), indicating that the period of LCRs is shorter than the spontaneous cycle length. B: Typical example of APs recorded in a rabbit SANC before, during superfusion with 15 μM PKI, and during washout of the drug. The relationship of PKI-induced suppression of SANC beating rate (solid line) and PLB phosphorylation of SANC suspensions (dashed line). Inset shows Western blots of phosphorylated PLB and total PLB in response to increasing PKI concentrations. Error bars indicate standard error of mean. C: Relationship between LCR period and spontaneous cycle length is shifted to shorter periods by β-AR stimulation with 0.1 μM ISO. Dashed line is the line of identity. D: The relative PKI and ISO effects to alter spontaneous cycle length over a wide range are linked to their effects on the LCR period within the same cells. Note that this relationship conforms to the line of identity. Square symbols and solid line depict the experimentally obtained data; triangular symbols depict the average data simulated by numerical model using experimentally measured changes in LCR characteristics and phase. Modified from [5].
Figure 11
Figure 11
A: LCR occurrences in the absence of changes in membrane potential in SANC with intact sarcolemma. Recordings of membrane potential (i), linescan image (ii), and normalized subsarcolemmal fluorescence (iii) averaged spatially over the band indicated by double headed arrow in (ii). (iv) Average total signal mass of LCRs during spontaneous beating and during voltage clamp (n = 14). B: Voltage clamp (VC) at the maximum diastolic potential decreases SR Ca2+ content and intracellular [Ca2+] in rabbit SANC. Spontaneous Ca2+ transients and caffeine-induced Ca2+ releases, indexed by F/F0, in a representative cell during spontaneous beating (i) and in a representative cell after several seconds of voltage clamp (iii). (ii) Average response to caffeine normalized to Ca2+ transient in cells during spontaneous beating and cells subjected to several seconds of voltage clamp. (iv) Averages of submembrane diastolic [Ca2+] before, during, and after voltage clamp in nine cells. *P<0.05. Error bars indicate standard error of mean. From [10].

References

    1. Cranefield PF. Action potentials, after potentials, and arrhythmias. Circ Res. 1977;41:415–23. - PubMed
    1. Maltsev VA, Vinogradova TM, Lakatta EG. The emergence of a general theory of the initiation and strength of the heartbeat. J Pharmacol Sci. 2006;100:338–69. - PubMed
    1. Hodgkin AL, Huxley AF. A quantitative description of membrane current and its application to conduction and excitation in nerve. J Physiol. 1952;117:500–44. - PMC - PubMed
    1. Noble D. Cardiac action and pacemaker potentials based on the Hodgkin-Huxley equations. Nature. 1960;188:495–7. - PubMed
    1. Vinogradova TM, Lyashkov AE, Zhu W, Ruknudin AM, Sirenko S, Yang D, Deo S, Barlow M, Johnson S, Caffrey JL, Zhou YY, Xiao RP, Cheng H, Stern MD, Maltsev VA, Lakatta EG. High basal protein kinase A-dependent phosphorylation drives rhythmic internal Ca2+ store oscillations and spontaneous beating of cardiac pacemaker cells. Circ Res. 2006;98:505–14. - PubMed

Publication types

MeSH terms

Substances