

doi: 10.1098/rstb.2007.2153.
Acoustic and auditory phonetics: the adaptive design of speech sound systems
Affiliations
- PMID: 17827108
- PMCID: PMC2606790
- DOI: 10.1098/rstb.2007.2153
Item in Clipboard
Acoustic and auditory phonetics: the adaptive design of speech sound systems
Philos Trans R Soc Lond B Biol Sci.
.
Abstract
Speech perception is remarkably robust. This paper examines how acoustic and auditory properties of vowels and consonants help to ensure intelligibility. First, the source-filter theory of speech production is briefly described, and the relationship between vocal-tract properties and formant patterns is demonstrated for some commonly occurring vowels. Next, two accounts of the structure of preferred sound inventories, quantal theory and dispersion theory, are described and some of their limitations are noted. Finally, it is suggested that certain aspects of quantal and dispersion theories can be unified in a principled way so as to achieve reasonable predictive accuracy.
Figures

Source–filter theory of speech production illustrated for the vowels / /, /u/, /i/ and /a/. (a) An idealized spectrum of the glottal airflow waveform, with a slope of −12 dB per octave, is displayed. The effective glottal spectrum slope (dotted curve) is −6 dB per octave owing to more efficient sound transmission from the mouth at higher frequencies. (b) Filter functions for the four vowels. (c) Product of the glottal source spectrum and the filter functions yields the acoustic output spectra. (Adapted with permission from Pickett (1999), Allyn & Bacon; adapted from Fant (1960) and Stevens & House (1961).)
/, /u/, /i/ and /a/. (a) An idealized spectrum of the glottal airflow waveform, with a slope of −12 dB per octave, is displayed. The effective glottal spectrum slope (dotted curve) is −6 dB per octave owing to more efficient sound transmission from the mouth at higher frequencies. (b) Filter functions for the four vowels. (c) Product of the glottal source spectrum and the filter functions yields the acoustic output spectra. (Adapted with permission from Pickett (1999), Allyn & Bacon; adapted from Fant (1960) and Stevens & House (1961).)
The standing pressure waves for the three lowest resonance frequencies (500, 1500, 2500 Hz) of the vowel //, produced with a vocal-tract (VT) length of 17.5 cm. Each standing wave satisfies the boundary conditions that an antinode exists at the closed (glottal) end of the vocal tract and a node exists at the open (lip) end. F1, F2 and F3 refer to the first three formants, corresponding to the first three resonances of the vocal tract. (Adapted with permission from Johnson (1997), Blackwell Publishers.)
/, produced with a vocal-tract (VT) length of 17.5 cm. Each standing wave satisfies the boundary conditions that an antinode exists at the closed (glottal) end of the vocal tract and a node exists at the open (lip) end. F1, F2 and F3 refer to the first three formants, corresponding to the first three resonances of the vocal tract. (Adapted with permission from Johnson (1997), Blackwell Publishers.)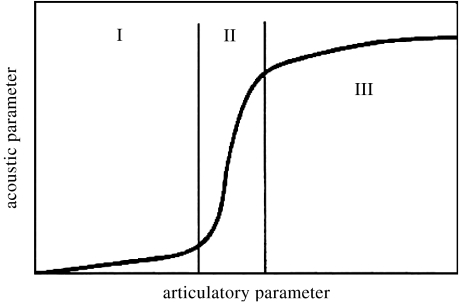
A schematic of a quantal nonlinearity in the mapping between an articulatory parameter of the vocal tract and the acoustic output. Regions I and III are acoustically quite stable with respect to perturbations in the articulatory parameter, whereas region II is acoustically unstable. Speech sound categories are assumed to be located in regions I and III. (Adapted with permission from Stevens (1989), Academic Press.)
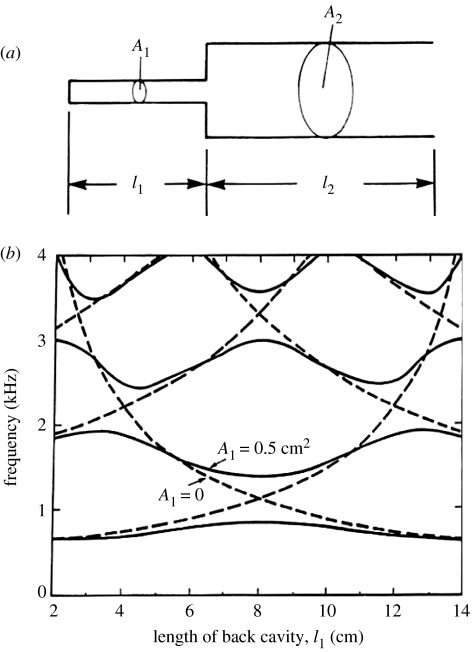
(a) A two-tube model of the vocal tract, with each tube effectively closed at the input end and open at the output end. The lengths of the left (back) and right (front) tubes are l1 and l2, and the cross-sectional areas are A1 and A2, respectively. (b) A nomogram representing the first four resonance frequencies for the two-tube model in (a) as the length l1 of the back cavity is varied, with overall length l1+l2 held constant at 16 cm and A2=3 cm2. The dashed curves represent the case where A1≫A2; the solid curves represent the case where A1=0.5 cm2. (Adapted with permission from Stevens (1989), Academic Press.)
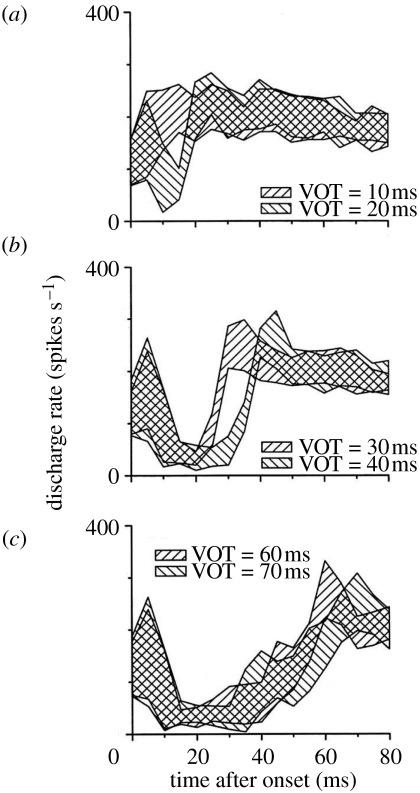
Auditory nerve responses in chinchilla to pairs of alveolar VOT stimuli in which the VOT difference was 10 ms. Each cross-hatched area encloses the mean±1 s.d. of the average discharge rates of neurons. (Adapted with permission of the first author from Sinex et al. (1991).)
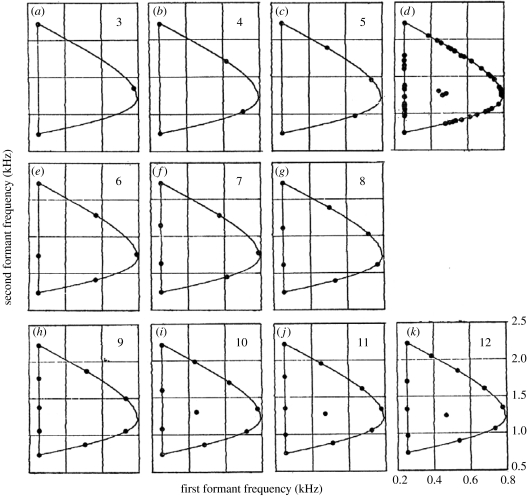
Results of simulations by Liljencrants & Lindblom (1972) of preferred vowel systems ranging in size from (a–c,e–k) 3 to 12. Solid curves represent the range of possible outputs from the articulatory model of Lindblom & Sundberg (1971), and filled circles correspond to the vowels selected according to a maximum distance criterion. (d) Pools all vowels selected across the 10 inventory sizes. (Adapted with permission of the second author from Liljencrants & Lindblom (1972). Linguistic Society of America.)

Approximate locations of major vowel categories within the space of outputs from the articulatory model of Lindblom & Sundberg (1971). (Adapted with permission of the second author from Liljencrants & Lindblom (1972), Linguistic Society of America.)
References
-
- Abramson, A. S. & Lisker, L. 1970 Discriminability along the voicing continuum: cross-language tests. In Proc. 6th Int. Cong. of Phonetic Sciences, Prague, 1967, pp. 569–573. Prague, Czech Republic: Academia.
-
- Aslin R.N, Pisoni D.B, Hennessy B.L, Perey A.J. Discrimination of voice onset time by human infants: new findings and implications for the effects of early experience. Child Dev. 1981;52:1135–1145. doi:10.2307/1129499 - DOI - PMC - PubMed
-
- Carlson R, Granström B. Towards an auditory spectrograph. In: Carlson R, Granström B, editors. The representation of speech in the peripheral auditory system. Elsevier Biomedical; Amsterdam, The Netherlands: 1982. pp. 109–114.
-
- Catford J.C. Indiana University Press; Bloomington, IN: 1977. Fundamental problems in phonetics.
-
- Chiba, T. & Kajiyama, M. 1941 The vowel: its nature and structure Tokyo, Japan: Tokyo-Kaisekan. (Reprinted by the Phonetic Society of Japan 1958.)
Publication types
MeSH terms
Grants and funding
LinkOut - more resources
Full Text Sources