. 2008 Jan 1;94(1):306-19.
doi: 10.1529/biophysj.107.110601. Epub 2007 Sep 7.

A comparison of step-detection methods: how well can you do?

Affiliations

A comparison of step-detection methods: how well can you do?

Brian C Carter et al. Biophys J. .

Abstract

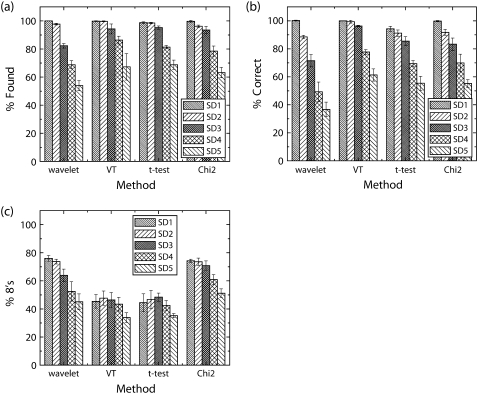
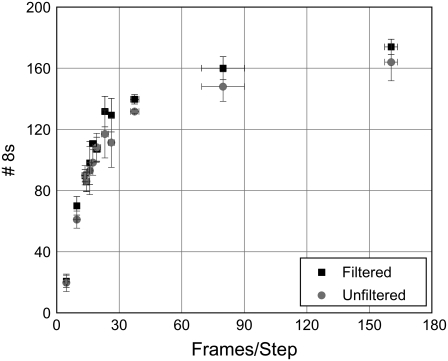
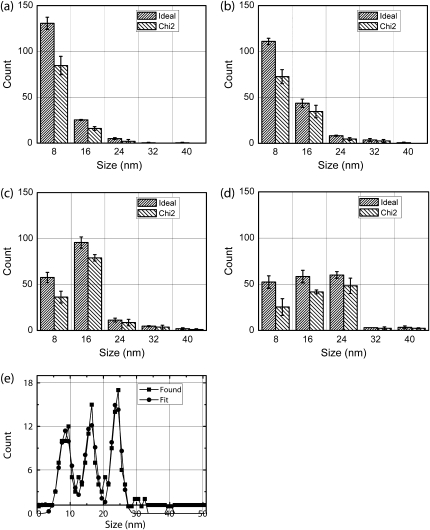
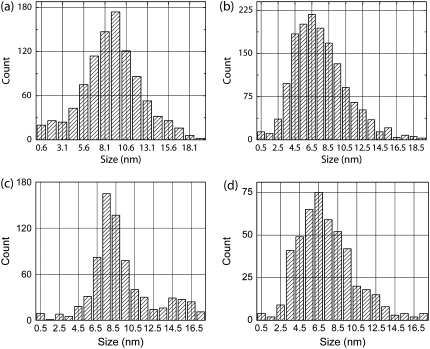
Many biological machines function in discrete steps, and detection of such steps can provide insight into the machines' dynamics. It is therefore crucial to develop an automated method to detect steps, and determine how its success is impaired by the significant noise usually present. A number of step detection methods have been used in previous studies, but their robustness and relative success rate have not been evaluated. Here, we compare the performance of four step detection methods on artificial benchmark data (simulating different data acquisition and stepping rates, as well as varying amounts of Gaussian noise). For each of the methods we investigate how to optimize performance both via parameter selection and via prefiltering of the data. While our analysis reveals that many of the tested methods have similar performance when optimized, we find that the method based on a chi-squared optimization procedure is simplest to optimize, and has excellent temporal resolution. Finally, we apply these step detection methods to the question of observed step sizes for cargoes moved by multiple kinesin motors in vitro. We conclude there is strong evidence for sub-8-nm steps of the cargo's center of mass in our multiple motor records.


Figures

FIGURE 1
FIGURE 1
Example of performance of the χ2 method. (a) The curve of the S parameter versus number of steps at noise SD 3 provides guidance for the optimal pick for the number of steps in a record being analyzed. (b) Three performance characteristics are shown for various choices of the number of steps (SD 3 noise), combining steps as described in text. Note that the performance in panel b is fairly stable over a large region near the peak value of the S parameter found in panel a.
FIGURE 2
FIGURE 2
Example of performance of the VT method. (a) The total steps found in the record being analyzed varies significantly as the threshold is increased. The graphs for VT method (window of 13) for SD1, 3, and 5 noise are shown. The plateau in the graphs is generally close to the optimal choice for the threshold. Note, however, that the plateau loses its definition at higher noise, making setting of the threshold difficult. (b) Three performance characteristics are shown for various choices of window size at SD3 noise for the VT method. For each window size, the threshold was found following rules described in the text for each of three runs and the mean and SD are plotted here. Percent Found and Correct remain stable across a wide variation in rank/window size. The Percent 8's decreases with increasing window size. As a result, mean performance (mean of all three parameters) also drops with increasing window size.
FIGURE 3
FIGURE 3
Comparison of step detection performance. Three performance characteristics, Percent Found, Percent Correct, and Percent 8's are shown in ac, respectively. Note that the dG wavelet method rapidly loses performance as noise level increases. The percent found and percent correct are similar for the other three methods (excluding VT at SD5). The t-test method, unlike the other methods, immediately finds a fair number of false steps as soon as noise appears in the signal.
FIGURE 4
FIGURE 4
Comparison of step detection performance after data filtering. Three performance characteristics are shown for (a) dG wavelet method, (b) t-test method, (c) VT method, and (d) χ2 method. The filters used are indicated in each panel along with their settings (e.g., rank for mean and median filters). For the wavelet method, the best performance is found with the mean filter. The t-test is better off with no filter applied. The VT method benefits from filtering, with the best performance coming from mean filtering. Finally, the χ2 method benefits modestly from filtering with the greatest improvement seen from mean filtering with nonlinear taking a close second. Noise level was SD5.
FIGURE 5
FIGURE 5
Fig. 3 reprised with best filter in place. Here again, Percent Found, Percent Correct, and Percent 8's are shown in ac, respectively. With best filter in place VT, t-test, and the χ2 methods all have very similar percent found and correct. Wavelet is still a poor performer when noise gets large, although its performance has improved considerably.
FIGURE 6
FIGURE 6
Step detection performance changes as a function of frames per step. The χ2 method was used to detect steps in three sample data sets with 200 total 8-nm steps each and SD3 noise. Step detection results with and without mean filter applied are shown. All data points represent the mean and SD of the results for the three data sets. Mean filter rank was chosen using a priori knowledge.
FIGURE 7
FIGURE 7
The χ2 method detection of 8-16 and 8-16-24 nm mixed step distributions. We have used data sets with (a) 100% 8's, (b) ∼80% 8's, (c) ∼40% 8's, and (d) approximately even mix of 8-, 16-, and 24-nm steps and SD5 noise to test χ2 performance. Panels ad show the mean and SD of three datasets. (e) The results of the χ2 method for a data set containing 60 8-nm steps, 56 16-nm steps, and 59 24-nm steps were binned to produce a histogram shown (squares). A fit of the histogram to a combination of three Gaussians is shown (circles). The fit suggests that ∼53 8-nm steps, ∼54 16-nm steps, and ∼57 24-nm steps were found by χ2 method.
FIGURE 8
FIGURE 8
Detection of steps in experimental and simulated data. Experimentally measured cargo motion in single motor and multi-motor assays was analyzed using the χ2 method and histograms of detected steps are shown in panels a and b, respectively. Note the skewed appearance of the multimotor step histogram. Additionally, 18 simulated runs of 50 steps each with all 8-nm steps and all 4-nm steps and SD6 level noise were also analyzed with the χ2 method. Two rate-limiting steps were assumed when generating the stepping datasets. Aggregate histograms of detected steps for all 8-nm steps and all 4-nm are shown in panels c and d, respectively. Methods: Taxol-stabilized microtubules were prepared as previously described (3). Kinesin assay was prepared as previously described (21). Data was acquired as described in Vershinin et al. (21) with custom software and procedures as described in main text.

Similar articles

Cited by

References

    1. Svoboda, K., C. F. Schmidt, B. J. Schnapp, and S. M. Block. 1993. Direct observation of kinesin stepping by optical trapping interferometry. Nature. 365:721–727. - PubMed
    1. Abbondanzieri, E. A., W. J. Greenleaf, J. W. Shaevitz, R. Landick, and S. M. Block. 2005. Direct observation of base-pair stepping by RNA polymerase. Nature. 438:460–465. - PMC - PubMed
    1. Mallik, R., B. C. Carter, S. A. Lex, S. J. King, and S. P. Gross. 2004. Cytoplasmic dynein functions as a gear in response to load. Nature. 427:649–652. - PubMed
    1. Nan, X., P. A. Sims, P. Chen, and X. S. Xie. 2005. Observation of individual microtubule motor steps in living cells with endocytosed quantum dots. J. Phys. Chem. B Condens. Matter Mater. Surf. Interfaces Biophys. 109:24220–24224. - PubMed
    1. Reck-Peterson, S. L., A. Yildiz, A. P. Carter, A. Gennerich, N. Zhang, and R. D. Vale. 2006. Single-molecule analysis of dynein processivity and stepping behavior. Cell. 126:335–348. - PMC - PubMed

Publication types

LinkOut - more resources