. 2007 Sep;19(9):2804-21.
doi: 10.1105/tpc.107.051870. Epub 2007 Sep 7.

N-myristoylation regulates the SnRK1 pathway in Arabidopsis

Affiliations

N-myristoylation regulates the SnRK1 pathway in Arabidopsis

Michèle Pierre et al. Plant Cell. 2007 Sep.

Abstract

Cotranslational and posttranslational modifications are increasingly recognized as important in the regulation of numerous essential cellular functions. N-myristoylation is a lipid modification ensuring the proper function and intracellular trafficking of proteins involved in many signaling pathways. Arabidopsis thaliana, like human, has two tightly regulated N-myristoyltransferase (NMT) genes, NMT1 and NMT2. Characterization of knockout mutants showed that NMT1 was strictly required for plant viability, whereas NMT2 accelerated flowering. NMT1 impairment induced extremely severe defects in the shoot apical meristem during embryonic development, causing growth arrest after germination. A transgenic plant line with an inducible NMT1 gene demonstrated that NMT1 expression had further effects at later stages. NMT2 did not compensate for NMT1 in the nmt1-1 mutant, but NMT2 overexpression resulted in shoot and root meristem abnormalities. Various data from complementation experiments in the nmt1-1 background, using either yeast or human NMTs, demonstrated a functional link between the developmental arrest of nmt1-1 mutants and the myristoylation state of an extremely small set of protein targets. We show here that protein N-myristoylation is systematically associated with shoot meristem development and that SnRK1 (for SNF1-related kinase) is one of its essential primary targets.


Figures
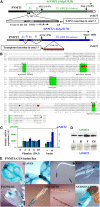
Figure 1.
Figure 1.
ORFs, Genes, and Expression Patterns of NMT1 and NMT2 in Various Organs and during Development. (A) Schematic representation of the wild-type At NMT gene structures and their disruption in Arabidopsis lines nmt1-1 and nmt2-1. The exon (En)–intron (In) structure of the gene is shown. Translation initiation (ATG) and termination codons (stop) are indicated. At NMT1: The tandem T-DNA insertion in the nmt1-1 line is shown, with the border sequences of the insert (left border [LB] and cloning vector) labeled to indicate the orientation of the insertion. BAR encodes the BASTA resistance gene. P35S is the 35S promoter. The exact location of the T-DNA insertion (+1/+49 from the origin of the transcript, as indicated in GenBank under accession number AF250956) was checked by DNA sequencing, PCR amplification, and restriction fragment length analysis. At NMT2: The location of the inserted transposon in line nmt2-1 is indicated from the origin of the transcript (as indicated in GenBank under accession number AF250957). The location of the inserted transposon end was checked by DNA sequencing, PCR amplification, and restriction fragment length analysis. (B) The full-length ORFs of each NMT used in this study were aligned using ClustalX (Jeanmougin et al., 1998). The numbering of each of the five amino acid sequences is indicated below the sequences for each block of 100 residues. Amino acids shown with an arrow at the N terminus of Hs NMT1 indicate the alternative translation start sites of each isoform. Line C shows strictly conserved residues within the catalytic core are shown below the amino acid sequence. Conservative changes are indicated with a plus sign. In the last line, the region highlighted in green corresponds to the binding sites of each substrate (Motifs 1 to 4). Residues shown in red are not conserved in At NMT2. At, Arabidopsis NMTs (At1 and At2); Sc, S. cerevisiae NMT; Hs, H. sapiens NMTs (Hs1 and Hs2). (C) Levels of transcripts for cytoplasmic NMTs expressed relative to actin transcript levels. Measurements were made by real-time PCR. Left: NMT1 or NMT2 levels in wild-type seedlings DAI 6 were taken as 1. The synthetic auxin variant used was 2,4-D (see Results). AU, arbitrary units. (D) Relative levels of At NMT1 and At NMT2 proteins. Left: Immunoblot analysis performed in leaves (L), roots (R), flowers (F), and cell suspensions (CS) with specific antibodies against each of these NMTs. (E) Expression of PNMT1:GUS in seedlings. Various NMT1 promoter-GUS (PNMT1:GUS) lines were analyzed. A representative image is shown in each case.
Figure 2.
Figure 2.
Phenotypes Associated with NMT1 Knockout in the nmt1-1 Line and Rescue with At NMT1. (A) Global phenotype of the nmt1-1 line. Left: Phenotypes of various independent nmt1-1 lines at various time points and their comparison with the wild type. A close-up of the nmt1-1 line is shown. The seedling was dissected to uncover the cotyledons, which are normally covered by the seed coat (see left part). (B) RT-PCR analysis of the NMT1 transcript in the nmt1-1 line. The EF transcript was used as the positive control probe. The reasons for transcript overproduction are given in Supplemental Figure 1 online. (C) Immunoblot analysis of seedlings 10 DAI, showing the absence of At NMT1 in the nmt1-1 line. We analyzed 80-μg aliquots of total protein. The band migrated at the expected Mr of ∼50 kD. (D) Complementation of the nmt1-1 line with the N1At1 construct leads to reversion to the wild type. Left: Comparison of the phenotypes of wild-type and nmt-1 plants stably expressing the N1At1 transgene (nmt-1-N1At1). Growth 35 DAI is shown. Right: Immunoblot analysis of the amount of At NMT1 in wild-type, nmt-1, or nmt-1-N1At1 lines. Proteins were extracted 7 DAI. PEPC, phosphoenolpyruvate carboxylase. Antibodies were provided by J. Vidal. (E) Analysis of the cytological phenotype of the nmt1-1 line and comparison with the wild type as observed 4 DAI. Left panel: Confocal imaging of the root meristem region stained with FM464. Center panel: Thin cross section of the SAM region stained with toluidine blue. The circle indicates the SAM. Right panel: Whole-mount cleared seeds observed with differential interference contrast microscopy at the heart embryo stage. The position of the SAM is indicated with an arrow.
Figure 3.
Figure 3.
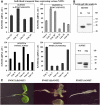
Variations in NMT2 Protein Levels in Various Backgrounds Induce Developmental Abnormalities in the Root and SAM. (A) Effect of At NMT2 knockout in the nmt2-2 line. Left: A set of 50 seedlings grown for 14 d on soil. Right: Measurements of the length of the inflorescence stems. (B) RT-PCR analysis showing the absence of NMT2 transcripts in line nmt2-1. The standard deviation on each of the measurements was 3.0, 2.6, and 12% for the wild type, PNMT1:At NMT2, and P35S:At NMT2, respectively. (C) Real-time PCR analysis of NMT2 transcript levels in the wild type as a function of the promoter used. An arbitrary value of 1 was assigned to At NMT2 levels in the wild type. (D) Phenotypes induced by NMT2 overexpression 4 DAI in the wild-type background. Arrows indicate unusual extra buds appearing at the SAM. Bottom right: Thin cross section of the SAM region stained as in Figure 2E, center panel. For the wild-type control, see Figure 3D. (E) Phenotypes observed in the nmt1-1 background. The arrows indicate the unusual additional roots observed in this background.
Figure 4.
Figure 4.
Further Developmental Defects Are Revealed with an NMT1 Ethanol-Inducible Line. (A) Real-time PCR analysis of the level of NMT1 transcripts in wild-type or F11 plants grown in the presence or absence of ethanol (EtOH). This analysis was based on leaf mRNA. The standard deviation on each of the measurements was 4, 4, and 7% for the wild type, F11-ethanol, and F11+ethanol, respectively. (B) Top: Immunoblot analysis of the amount of NMT1 in wild-type or F11 plants grown in the presence or absence of ethanol for the indicated time. The analysis was based on proteins from leaves and flowers. Bottom: Ponceau red staining of the corresponding gel sample confirming equal protein loading. The arrowheads indicate the position of the Mr marker (175, 94, 67, 46, and 30 kD). The major band corresponds to the large chain of ribulose-1,5-bisphosphate carboxylase/oxygenase. (C) Reversal of the phenotype of a given seedling induced by ethanol. F11 seedlings were grown in the absence of ethanol for 2 weeks (yellow circle). NMT1 was induced in the presence of ethanol vapor for 1 week. The new flower shoots appearing as a result of this induction are circled in white. (D) New phenotypes associated with the lack of NMT1 as discovered in F11 plants grown in the presence or absence of ethanol. Wild-type plants grown in the presence or absence of ethanol had phenotypes similar to that of F11 grown in the presence of ethanol. (E) PR-1 transcripts are induced in the absence of ethanol in line F11. Top: RT-PCR analysis of PR-1 (PR) and EF-1 (EF) transcripts. A mixture of 10 distinct plants was used and only technical replicates performed in this case. Bottom: Phenotype of the corresponding flowers in plants with necrotic leaves.
Figure 5.
Figure 5.
Complementation with Orthologous NMT1s in the nmt1-1 Background. (A) Real-time PCR analysis of the level of each NMT transcript in the wild type under control of the At NMT1 promoter. An asterisk indicates that the corresponding transgene complemented the nmt1-1 line. Values for individual lines generated in the nmt1/NMT1 background are reported. An arbitrary value (AU) of 100 was assigned to the highest value obtained with each NMT construct. The vertical bar indicates the sd. (B) Immunoblot analysis showing the translation of each NMT in plant extracts. Proteins with an N-terminal fusion to the poly-His tag were produced in wheat germ extract, separated by electrophoresis, blotted, and detected with anti-His antibodies. (C) Phenotypes observed in the nmt1-1 background (10 DAI).
Figure 6.
Figure 6.
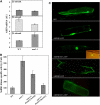
Increased Kinase Activity and Relocalization of AKINβ1 upon MYR Inhibition. (A) Real-time PCR analysis of the level of each AKINβ1, -β2, and -β3 transcript at DAI 3 in the wild type and nmt1-1. An arbitrary value of 1 corresponds to similar mRNA content in all three cases. The vertical bar indicates the sd. (B) SnRK1 activity assay in various genetic backgrounds including the wild type, nmt1-1+PNMT1:Hs NMT1, nmt1-1+PNMT1:Sc NMT, and nmt1-1. Each measurement was started with soluble protein extracts prepared from seedlings at a developmental stage corresponding to DAI 3. Protein concentration was measured in each case, and the same amount of protein was added to each assay. Three biological replicates were performed, and the sd is shown in each case. The data correspond to those obtained with the AMARA peptide as the substrate. We obtained similar results with the SAMS peptide. Activity unit is expressed as nanomoles of radioactive phosphate incorporated per 45 min and per microgram of protein at 30°C. A value of 100 was assigned to the wild type. (C) Fluorescence microscopy analysis of the expression of various GFP fusions in plant cells. From top to bottom, as indicated in each image: GFP (control), AKINβ1:GFP, AKINβ1[G2A]:GFP, AKINβ2:GFP, and AKINβ2[G2A]:GFP fusions. The inset in the AKINβ1[G2A]:GFP figure corresponds to the Nomarski image of the same cell, showing the nucleus.

Similar articles

Cited by

References

    1. Arabidopsis Genome Initiative (2000). Analysis of the genome sequence of the flowering plant Arabidopsis thaliana. Nature 408 796–815. - PubMed
    1. Ashrafi, K., Farazi, T.A., and Gordon, J.I. (1998). A role for Saccharomyces cerevisiae fatty acid activation protein E in regulating N-myristoylation during entry into stationary phase. J. Biol. Chem. 273 25864–25874. - PubMed
    1. Ashrafi, K., Lin, S.S., Manchester, J.K., and Gordon, J.I. (2000). Sip2p and its partner snf1p kinase affect aging in S. cerevisiae. Genes Dev. 14 1872–1885. - PMC - PubMed
    1. Beeckman, T., and Viane, R. (1999). Embedding thin plant specimens for oriented sectioning. Biotech. Histochem. 75 23–26. - PubMed
    1. Bhatnagar, R.S., Ashrafi, K., Futterer, K., Waksman, G., and Gordon, J.I. (2001). Biology and enzymology of protein N-myristoylation. In The Enzymes, F. Tamanoi and D.S. Sigman, eds (San Diego, CA: Academic Press), pp. 241–286.

Publication types

MeSH terms