. 2007 Sep;3(9):1739-50.
doi: 10.1371/journal.pcbi.0030175.

Orthologous transcription factors in bacteria have different functions and regulate different genes

Affiliations

Orthologous transcription factors in bacteria have different functions and regulate different genes

Morgan N Price et al. PLoS Comput Biol. 2007 Sep.

Abstract

Transcription factors (TFs) form large paralogous gene families and have complex evolutionary histories. Here, we ask whether putative orthologs of TFs, from bidirectional best BLAST hits (BBHs), are evolutionary orthologs with conserved functions. We show that BBHs of TFs from distantly related bacteria are usually not evolutionary orthologs. Furthermore, the false orthologs usually respond to different signals and regulate distinct pathways, while the few BBHs that are evolutionary orthologs do have conserved functions. To test the conservation of regulatory interactions, we analyze expression patterns. We find that regulatory relationships between TFs and their regulated genes are usually not conserved for BBHs in Escherichia coli K12 and Bacillus subtilis. Even in the much more closely related bacteria Vibrio cholerae and Shewanella oneidensis MR-1, predicting regulation from E. coli BBHs has high error rates. Using gene-regulon correlations, we identify genes whose expression pattern differs between E. coli and S. oneidensis. Using literature searches and sequence analysis, we show that these changes in expression patterns reflect changes in gene regulation, even for evolutionary orthologs. We conclude that the evolution of bacterial regulation should be analyzed with phylogenetic trees, rather than BBHs, and that bacterial regulatory networks evolve more rapidly than previously thought.


Conflict of interest statement

Competing interests. The authors have declared that no competing interests exist.

Figures

Figure 1
Figure 1. Phylogeny of Sequenced Members of the Proteobacteria and the Firmicutes
Figure 2
Figure 2. Evolutionary Histories of “Orthologous” Transcription Factors from E. coli K12 and B. subtilis
(Left panels) For each pair of BBHs, we selected illustrative homologs and constructed a gene tree with TreePuzzle [43]. For confident clades, we show the support values. Close homologs from distantly related taxa are evidence for horizontal transfer events, and close homologs within one genome (i.e., paralogs) are evidence for duplication events. The rooting is arbitrary. (Center panels) The presence and absence of close homologs of the E. coli gene within β,γ-Proteobacteria, and the number of loss events required to explain the gene's distribution if HGT did not occur. (Right panels) Presence/absence of close homologs of the B. subtilis gene within Firmicutes.
Figure 3
Figure 3. Bidirectional Best Hits of crp and fnr Are Not Orthologs
We show selected clades from a phylogenetic tree of all BBHs of E. coli crp and E. coli fnr. For each gene, we show whether it is a BBH of crp or of fnr and what genome it is from. (The genome names include strain identifiers.) For each intermediate node, we show the bootstrap score (out of 100). The mixture of putative “crp” and “fnr” genes within well-supported clades shows that one or both assignments are incorrect. We also show which taxonomic group the genomes belong to. Except for the boxed Cyanobacteria, each clade in the gene tree corresponds to a taxonomic group in the species tree, which confirms that the gene tree is accurate and that the BBHs are misleading.
Figure 4
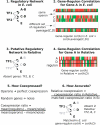
Figure 4. Using Patterns of Gene Expression To Test Putative Regulation in Relatives of E. coli
(Steps 1–4) We use “gene–regulon” correlations to see if the regulation agrees with microarray data, both in E. coli and in its relatives. To compute gene–regulon correlations, we first average the expression pattern (the log-ratios) for other genes that are not in the same operon and are regulated by the same set of TFs. The rationale for using gene–regulon correlations instead of gene–gene correlations is explained in Methods. If the gene–regulon correlation is high in E. coli and low in the relative, then the regulation may have changed. (Step 5) To correct for the varying quality and quantity of the microarray data for the different species, we use operons as a positive control and random pairs of genes as a negative control. Thus, the “coexpression ratio” should depend on the accuracy of the predictions, and not on the quality of the microarray data. (Step 6) To quantify how the predictions compare with regulation in E. coli, we use the “relative coexpression.” To control for the absence of genes in the related organism, we compare the coexpression ratio in the related organism to a “matched” coexpression ratio that uses only E. coli genes that have BBHs in that organism.
Figure 5
Figure 5. Coexpression Analysis Shows That Predicting Transcriptional Regulation from BBHs of Known Regulation Is Not Reliable
(A) The distribution of gene–regulon correlations in E. coli. As a positive control, we show the correlation between adjacent genes that are predicted to be in the same operon. As a negative control, we show the correlation between random pairs of genes. (B–E) Correlations between genes and their putative regulons in other species, as predicted from BBHs of E. coli genes and TFs. The controls are as in (A). For B. subtilis (E), we also show gene–regulon correlations from known regulation in that organism [21]. (F) Phylogeny of the organisms and summary statistics that compare the predictions to true coregulation in E. coli and B. subtilis. See Figure 4 for more detailed definitions.

Similar articles

Cited by

References

    1. Guédon E, Jamet E, Renault P. Gene regulation in Lactococcus lactis: The gap between predicted and characterized regulators. Antonie van Leeuwenhoek. 2002;82:93–112. - PubMed
    1. Rajewsky N, Socci ND, Zapotocky M, Siggia ED. The evolution of DNA regulatory regions for proteo-gamma bacteria by interspecies comparisons. Genome Res. 2002;12:298–308. - PMC - PubMed
    1. Gelfand MS. Evolution of transcriptional regulatory networks in microbial genomes. Curr Opin Struct Biol. 2006;16:420–429. - PubMed
    1. Lozada-Chavez I, Janga SC, Collado-Vides J. Bacterial regulatory networks are extremely flexible in evolution. Nucleic Acids Res. 2006;34:3434–3445. - PMC - PubMed
    1. Babu MM, Teichmann SA, Aravind L. Evolutionary dynamics of prokaryotic transcriptional regulatory networks. J Mol Biol. 2006;358:614–633. - PubMed

Publication types

MeSH terms