. 2007 Sep 10;178(6):925-36.
doi: 10.1083/jcb.200703081.

Suv4-20h deficiency results in telomere elongation and derepression of telomere recombination

Affiliations

Suv4-20h deficiency results in telomere elongation and derepression of telomere recombination

Roberta Benetti et al. J Cell Biol. .

Abstract

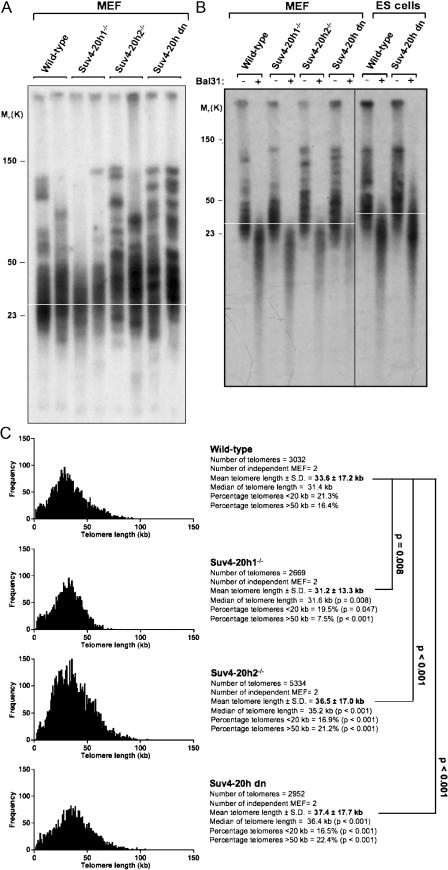
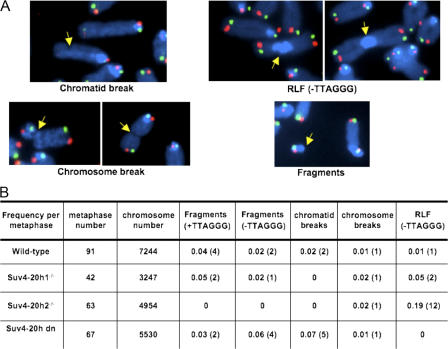
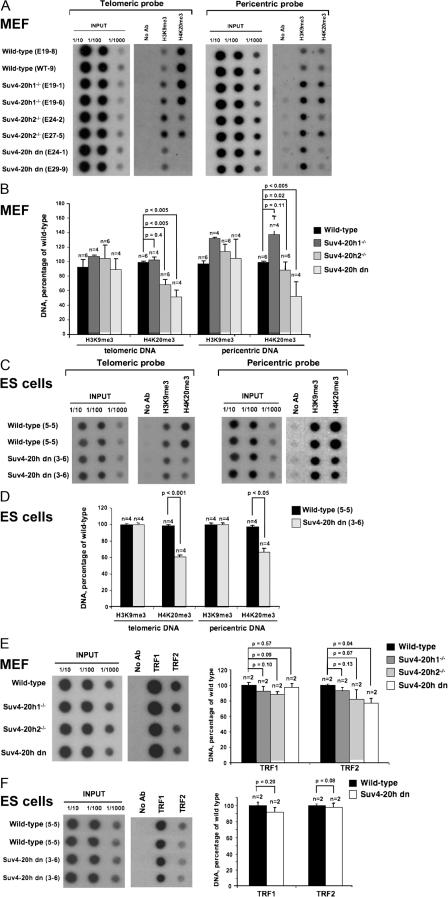
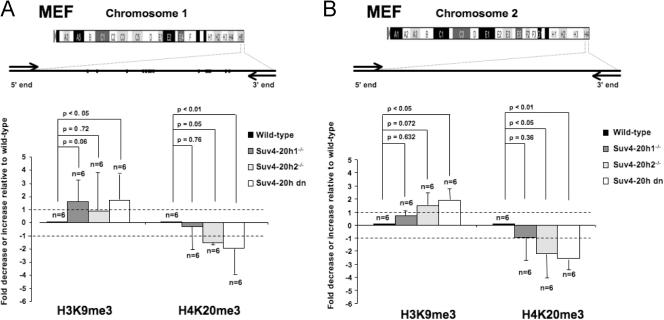
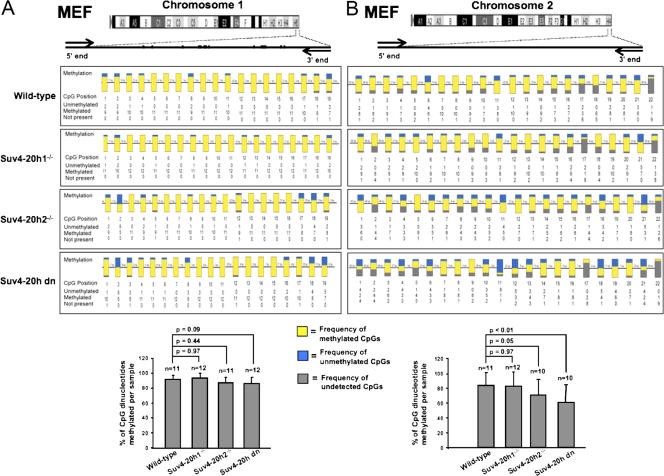
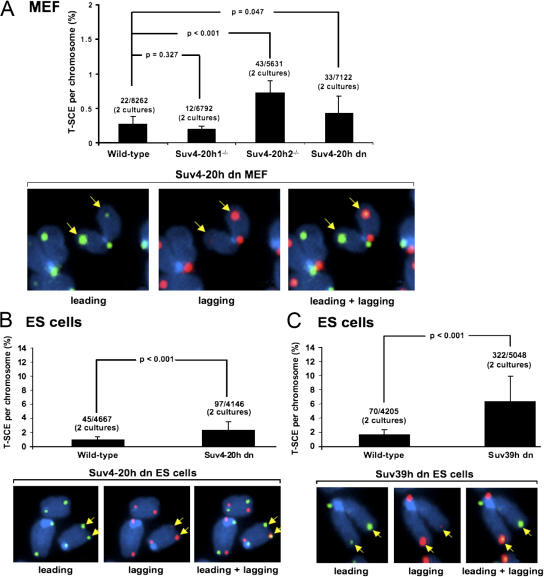
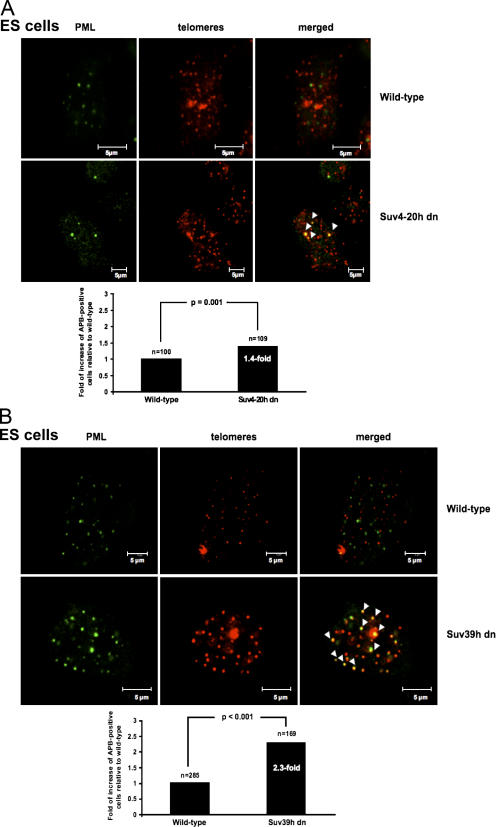
Mammalian telomeres have heterochromatic features, including trimethylated histone H3 at lysine 9 (H3K9me3) and trimethylated histone H4 at lysine 20 (H4K20me3). In addition, subtelomeric DNA is hypermethylated. The enzymatic activities responsible for these modifications at telomeres are beginning to be characterized. In particular, H4K20me3 at telomeres could be catalyzed by the novel Suv4-20h1 and Suv4-20h2 histone methyltransferases (HMTases). In this study, we demonstrate that the Suv4-20h enzymes are responsible for this histone modification at telomeres. Cells deficient for Suv4-20h2 or for both Suv4-20h1 and Suv4-20h2 show decreased levels of H4K20me3 at telomeres and subtelomeres in the absence of changes in H3K9me3. These epigenetic alterations are accompanied by telomere elongation, indicating a role for Suv4-20h HMTases in telomere length control. Finally, cells lacking either the Suv4-20h or Suv39h HMTases show increased frequencies of telomere recombination in the absence of changes in subtelomeric DNA methylation. These results demonstrate the importance of chromatin architecture in the maintenance of telomere length homeostasis and reveal a novel role for histone lysine methylation in controlling telomere recombination.


Figures

Figure 1.
Figure 1.
Deregulation of telomere length in MEFs deficient for Suv4-20h HMTases. (A) TRF results obtained with MEFs derived from two embryos of each of the wild-type, Suv4-20h1−/−, Suv4-20h2−/−, and Suv4-20h dn genotypes. Note the increased TRF size in Suv4-20h2−/− and Suv4-20h dn MEFs corresponding to longer telomeres. A white line is shown to facilitate the comparison of TRF sizes between different genotypes. (B) TRF results obtained with the indicated MEFs or ES cells, which were pretreated (+) or not pretreated (−) with Bal31 exonuclease. Note that TRF fragments are degraded upon Bal31 treatment, which is in agreement with the notion that they correspond to telomeric fragments. Note the increased TRF size in Suv4-20h dn MEFs and ES cells compared with the wild-type and Suv4-20h1−/− genotypes. A white line is shown to facilitate the comparison of TRF sizes between different genotypes. (C) Telomere length distribution of wild-type, Suv4-20h1−/−, Suv4-20h2−/−, and Suv4-20h dn MEFs as determined by Q-FISH. Two MEF cultures of each genotype were analyzed. A significant increase in mean telomere length is observed in Suv4-20h2−/− and Suv4-20h dn MEFs. Mean telomere length ± SD is indicated in bold characters. The total number of telomeres analyzed as well as the percentage of telomeres <20 kb and >50 kb are indicated. Statistical significance is calculated using the Wilcoxon rank-sum test. P-values are indicated in the figure.
Figure 2.
Figure 2.
Detailed karyotyping analysis of Suv4-20h–deficient MEFs. (A) Representative examples of the indicated chromosomal aberrations (indicated by yellow arrows) after chromosome orientation FISH (see Materials and methods). Blue, DAPI; green, leading telomere; red, lagging telomere. (B) Quantification of the frequency of chromosomal aberrations per metaphase in the indicated genotypes. Two independent MEF cultures were analyzed per genotype. The number of metaphases and the number of chromosomes analyzed per genotype are indicated. Numbers in parentheses correspond to the absolute number of aberrations detected in the indicated numbers of metaphases analyzed.
Figure 3.
Figure 3.
Defective assembly of telomeric chromatin in Suv4-20h–deficient MEFs. (A and B) ChIP of wild-type, Suv4-20h1−/−, Suv4-20h2−/−, and Suv4-20h dn MEFs with the indicated antibodies. Quantification of immunoprecipitated telomeric and pericentric repeats was normalized to input signals. Numbers in parentheses refer to individual MEF cultures. (B) At least two independent cultures per genotype were used for the analysis. No reproducible changes in H3K9me3 at telomeres or pericentric chromatin were observed between WT and the different Suv4-20h–deficient cells. In contrast, H4K20me3 was significantly reduced both at telomeric and pericentric heterochromatin in Suv4-20h2−/− and Suv4-20h dn MEFs but not in Suv4-20h1−/− MEFs. (C and D) ChIP of wild-type and Suv4-20h dn ES cells with the indicated antibodies. Quantification of immunoprecipitated telomeric and pericentric repeats was normalized to input signals. Numbers in parentheses refer to individual ES cell cultures. (D) No reproducible changes in H3K9me3 at telomeres or pericentric chromatin were observed between WT and Suv4-20h dn cells. In contrast, H4K20me3 was significantly reduced both at telomeric and pericentric heterochromatin in Suv4-20h dn ES cells. (E) ChIP of wild-type, Suv4-20h1−/−, Suv4-20h2−/−, and Suv4-20h dn MEFs with TRF1 and TRF2 antibodies. Quantification of immunoprecipitated telomeric repeats was normalized to input signals. (F) ChIP of wild-type and Suv4-20h dn ES cells with TRF1 and TRF2 antibodies. Quantification of immunoprecipitated telomeric repeats was normalized to input signals. (B, and D–F) ChIP values are represented as percentages of the wild-type, which was set to 100. (B and D–F) Error bars correspond to SD of the total number of ChIP assays performed for each genotype (n).
Figure 4.
Figure 4.
Defective assembly of subtelomeric chromatin in Suv4-20h–deficient MEFs. (A) Scheme of chromosome 1 used for RT-PCR analysis of subtelomeric histone modifications. RT-PCR–based ChIP analysis of H3K9me3 and H4K20me3 abundance is quantified in the bottom panel. At least two independent MEF cultures per genotype were used for the analysis. (B) Scheme of chromosome 2 used for RT-PCR analysis of subtelomeric histone modifications. RT-PCR–based ChIP analysis of H3K9me3 and H4K20me3 abundance is quantified in the bottom panel. At least two independent MEF cultures per genotype were used for the analysis. (A and B) Primer sequences are shown in Materials and methods. Error bars represent SD of the total number of ChIP assays performed for each genotype (n).
Figure 5.
Figure 5.
Normal DNA methylation of subtelomeric domains in Suv4-20h–deficient MEFs. (A) Scheme of chromosome 1 depicting the subtelomeric region used for bisulfite genomic sequencing. 11–12 independent clones per genotype were analyzed (n). Yellow and blue represent the frequency of methylated and unmethylated CpG dinucleotides, respectively, at each position. Quantification of the percentage of methylated CpGs per sample after bisulfite genomic sequencing of 11–12 clones of each genotype is shown in the bottom panel. (B) Scheme of chromosome 2 depicting the subtelomeric region used for bisulfite genomic sequencing. 10–12 independent clones per genotype were analyzed (n). Yellow and blue represent the frequency of methylated and unmethylated CpG dinucleotides, respectively, at each position. Quantification of the percentage of methylated CpGs per sample after bisulfite genomic sequencing of 10–12 clones of each genotype is shown in the bottom panel. (A and B) Error bars represent SD of the differences among all independent clones (n). Primer sequences are provided in Materials and methods.
Figure 6.
Figure 6.
Increased telomeric SCE in cells deficient for HMTases Suv39h and Suv4-20h. (A) Quantification of T-SCE events in wild-type and the indicated Suv4-20h–deficient cells. A significant increase in T-SCE is observed in Suv4-20h2−/− and Suv4-20h dn MEFs (χ2 test; P < 0.05) but not in Suv4-20h1−/− MEFs (χ2 test; P = 0.3271). The total number of T-SCE events out of the total number of chromosomes analyzed (between 5,000 and 8,000) is indicated on top of each bar. Error bars correspond to SD of the total number of independent MEF cultures used for the analysis (n). (B) Quantification of T-SCE events in wild-type and Suv4-20h1/h2–deficient ES cells (Suv39h dn ES cells). A significant increase in T-SCE is observed in Suv4-20h dn ES cells compared with the wild-type controls (χ2 test; P < 0.0001). The total number of T-SCE events out of the total number of chromosomes analyzed (>4,000) is indicated on top of each bar. Error bars correspond to SD of the total number of independent ES cultures used for the analysis (n). (C) Quantification of T-SCE events in wild-type and Suv39h1/h2-deficient cells (Suv39h dn cells). A significant increase in T-SCE is observed in Suv39h dn ES cells compared with the wild-type controls (χ2 test; P < 0.0001). The total number of T-SCE events out of the total number of chromosomes analyzed (between 4,000 and 5,000) is indicated on top of each bar. Error bars correspond to the total number of independent ES cultures used for the analysis (n). (A–C) Representative chromosome orientation FISH images after labeling leading (green) and lagging (red) strand telomeres are shown in the bottom panel. The yellow arrows indicate chromosomes showing recombination between telomeres. Note that in all cases, a T-SCE event was only considered positive when it was observed both at the lagging and leading strand telomeres as an unequal exchange of telomeric signal.
Figure 7.
Figure 7.
Increased APBs in ES cells deficient for Suv4-20h and Suv39h HMTases. (A and B) Confocal microscopy images showing either PML fluorescence (green), telomere fluorescence (red), or combined fluorescence (yellow) in wild-type, Suv4-20h dn (A), and Suv39h dn (B) ES cells. Note that some of the PML bodies in HMT-deficient cells colocalize with telomeric DNA (indicated by arrowheads), and this is not seen in wild-type cells. Fold increase of the percentage of cells showing the colocalization of telomeres with PML protein is shown in the bottom panels. A cell was considered positive when it showed two or more colocalization events. An increased frequency of cells showing APBs is observed in the Suv4-20h dn and Suv39h dn ES cells when compared with the WT ES cells. The total number of cells used for the analysis is indicated (n).

References

    1. Bailey, S.M., M.N. Cornforth, A. Kurimasa, D.J. Chen, and E.H. Goodwin. 2001. Strand-specific postreplicative processing of mammalian telomeres. Science. 293:2462–2465. - PubMed
    1. Bailey, S.M., M.A. Brenneman, and E.H. Goodwin. 2004. Frequent recombination in telomeric DNA may extend the proliferative life of telomerase-negative cells. Nucleic Acids Res. 32:3743–3751. - PMC - PubMed
    1. Bechter, O.E., Y. Zou, W. Walker, W.E. Wright, and J.W. Shay. 2004. Telomeric recombination in mismatch repair deficient human colon cancer cells after telomerase inhibition. Cancer Res. 64:3444–3451. - PubMed
    1. Benetti, R., M. García-Cao, and M.A. Blasco. 2007. Telomere length regulates the epigenetic status of mammalian telomeres and subtelomeres. Nat. Genet. 39:243–250. - PubMed
    1. Blasco, M.A. 2005. Telomeres and human disease: ageing, cancer and beyond. Nat. Rev. Genet. 6:611–622. - PubMed

Publication types

Substances