

Subject-specific model estimation of cardiac output and blood volume during hemorrhage
- PMID: 17846886
- PMCID: PMC3629970
- DOI: 10.1007/s10558-007-9035-7
Subject-specific model estimation of cardiac output and blood volume during hemorrhage
Abstract
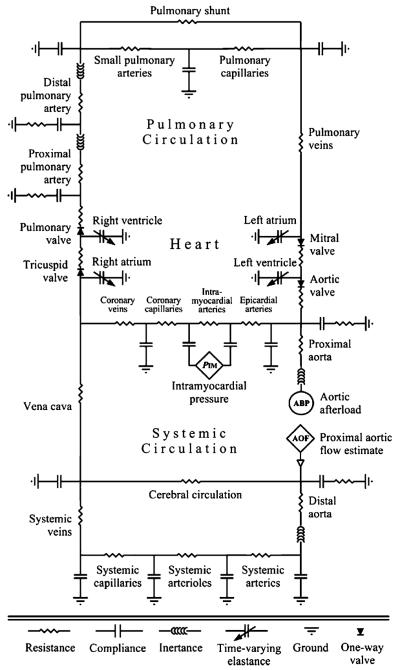
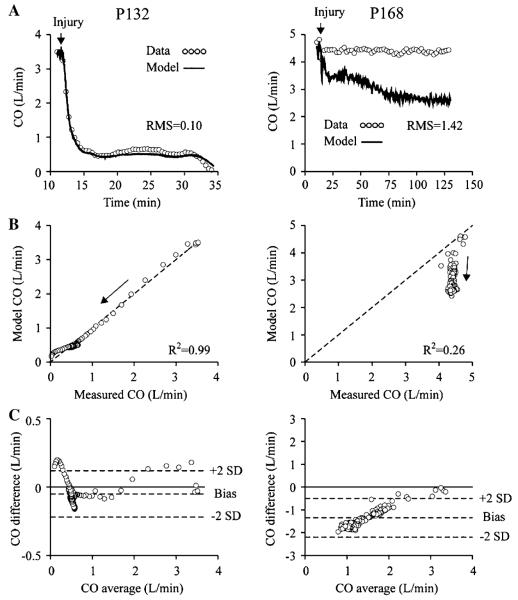
We have developed a novel method for estimating subject-specific hemodynamics during hemorrhage. First, a mathematical model representing a closed-loop circulation and baroreceptor feedback system was parameterized to match the baseline physiology of individual experimental subjects by fitting model results to 1 min of pre-injury data. This automated parameterization process matched pre-injury measurements within 1.4 +/- 1.3% SD. Tuned parameters were then used in similar open-loop models to simulate dynamics post-injury. Cardiac output (CO) estimates were obtained continuously using post-injury measurements of arterial blood pressure (ABP) and heart rate (HR) as inputs to the first open-loop model. Secondarily, total blood volume (TBV) estimates were obtained by summing the blood volumes in all the circulatory segments of a second open-loop model that used measured CO as an additional input. We validated the estimation method by comparing model CO results to flowprobe measurements in 14 pigs. Overall, CO estimates had a Bland-Altman bias of -0.30 l/min with upper and lower limits of agreement 0.80 and -1.40 l/min. The negative bias is likely due to overestimation of the peripheral resistance response to hemorrhage. There was no reference measurement of TBV; however, the estimates appeared reasonable and clearly predicted survival versus death during the post-hemorrhage period. Both open-loop models ran in real time on a computer with a 2.4 GHz processor, and their clinical applicability in emergency care scenarios is discussed.
Figures


References
-
- Altman PL, Dittmer DS, editors. Respiration and circulation. Federation of American Societies for Experimental Biology; Bethesda, Maryland: 1971. 930 pp.
-
- Athanasiades A, Ghorbel F, Clark JW, Jr, Niranjan SC, Olansen J, Zwischenberger JB, Bidani A. Energy analysis of a nonlinear model of the normal human lung. J Biol Syst. 2000;8:115–39.
-
- Avolio AP. Multi-branched model of the human arterial system. Med Biol Eng Comput. 1980;18:709–18. - PubMed
-
- Bland JM, Altman DG. Statistical methods for assessing agreement between two methods of clinical measurement. Lancet. 1986;8:307–10. - PubMed
-
- Bourgeois MJ, Gilbert BK, Von Bernuth G, Wood EH. Continuous determination of beat to beat stroke volume from aortic pressure pulses in the dog. Circ Res. 1976;39:15–24. - PubMed
Publication types
MeSH terms
Grants and funding
LinkOut - more resources
Full Text Sources
Other Literature Sources
Medical
Miscellaneous