. 2007 Sep 6;4(4):223-31.
doi: 10.7150/ijms.4.223.

Chlamydia trachomatis infection of human trophoblast alters estrogen and progesterone biosynthesis: an insight into role of infection in pregnancy sequelae

Affiliations

Chlamydia trachomatis infection of human trophoblast alters estrogen and progesterone biosynthesis: an insight into role of infection in pregnancy sequelae

Anthony A Azenabor et al. Int J Med Sci. .

Abstract

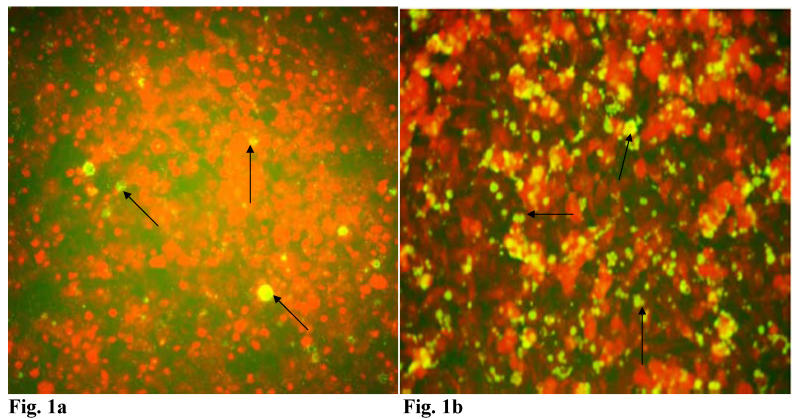
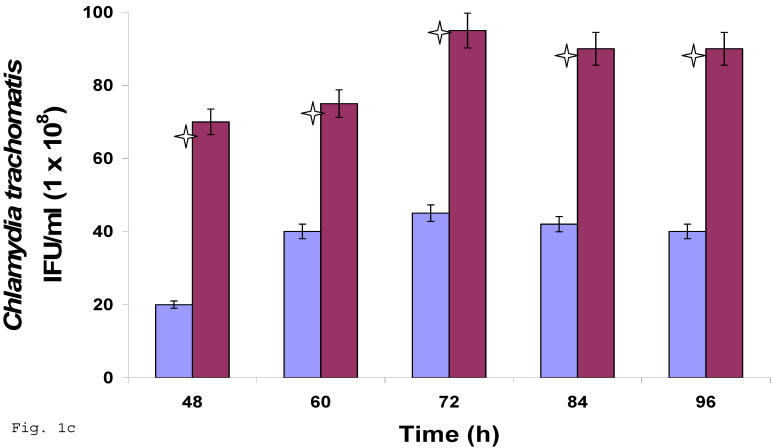
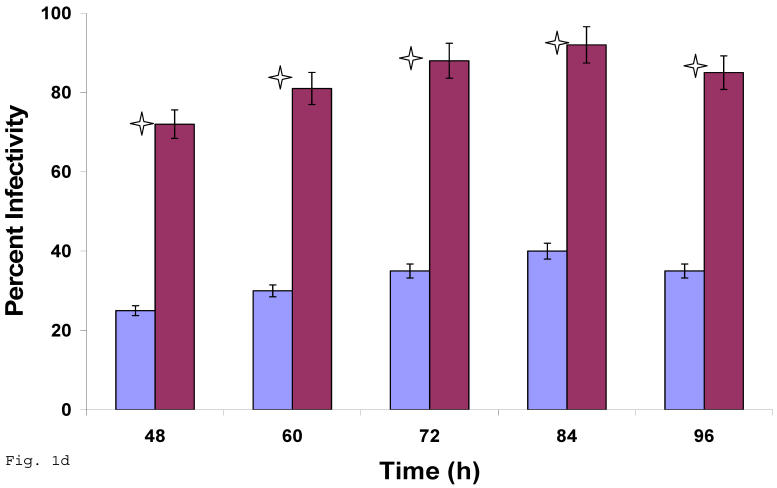
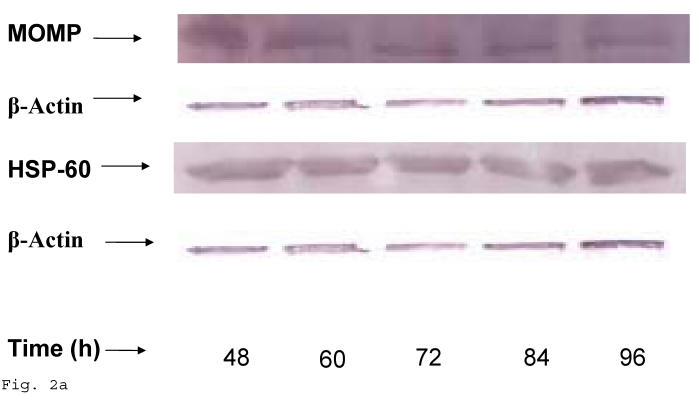
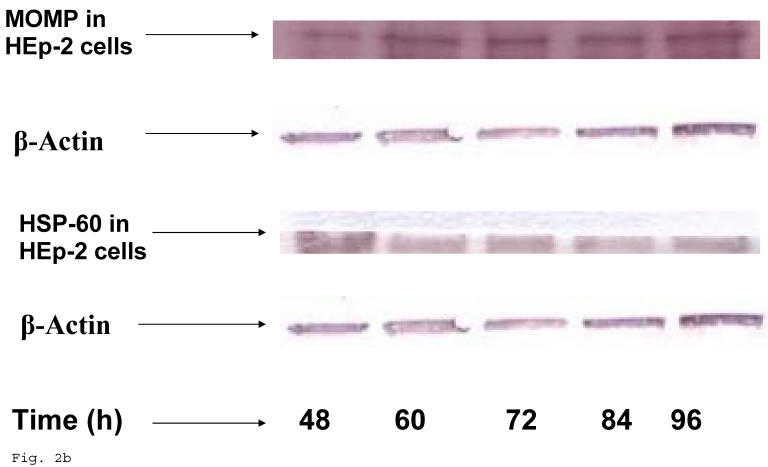
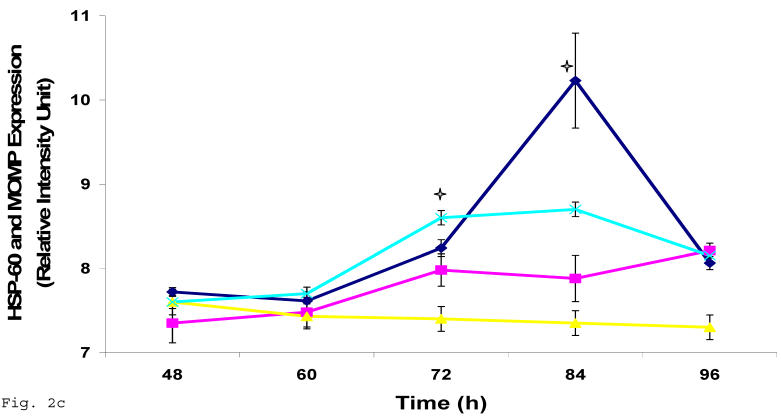
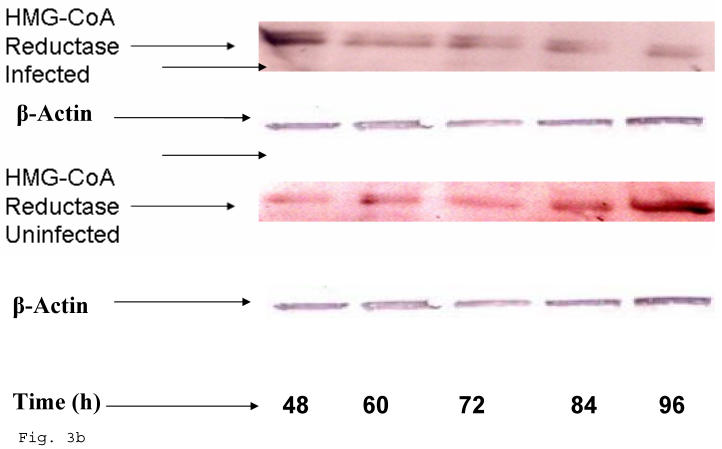
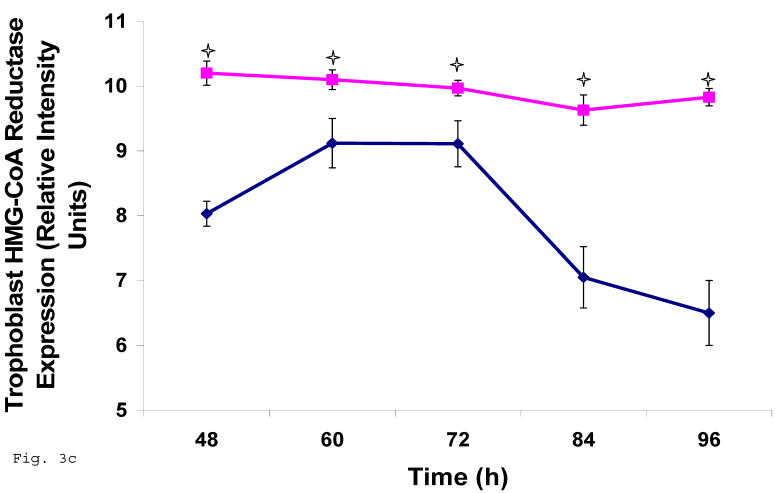
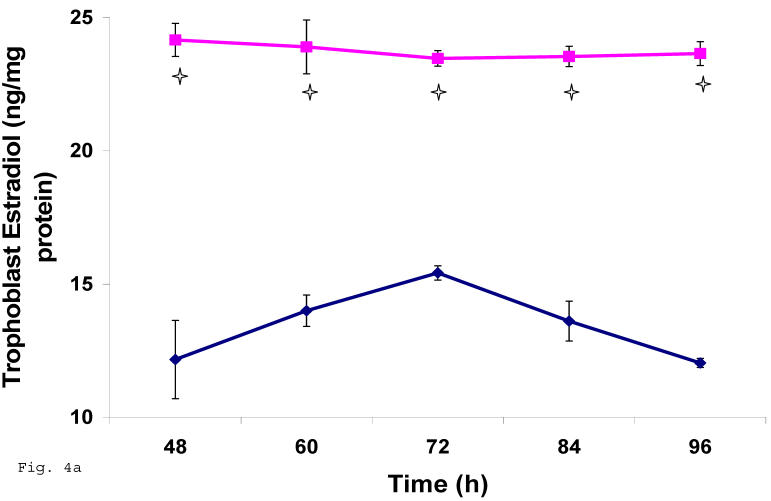
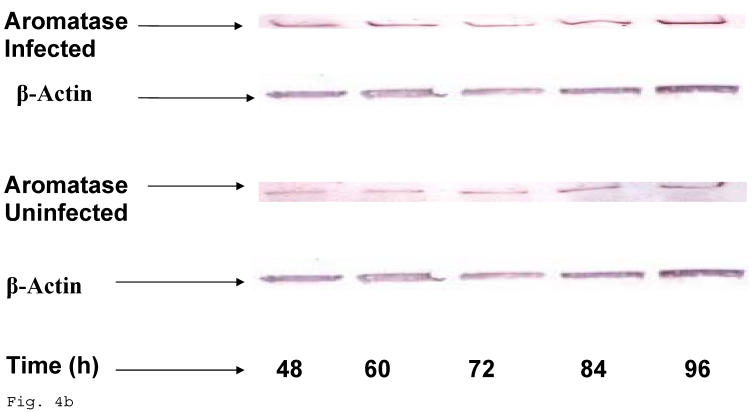
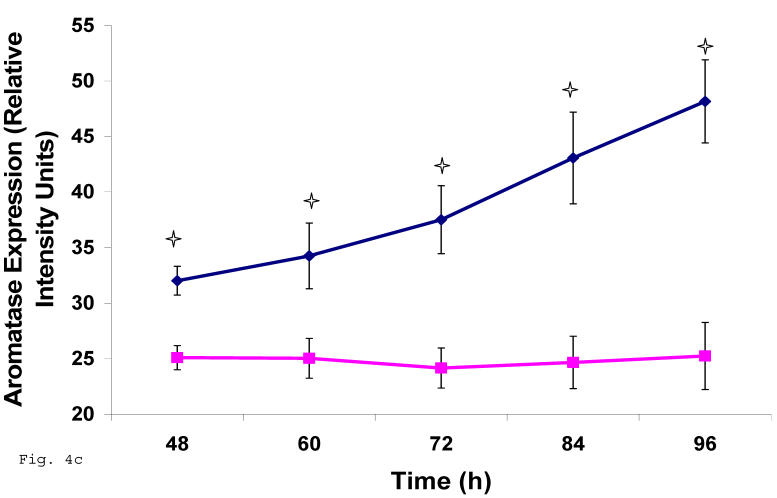
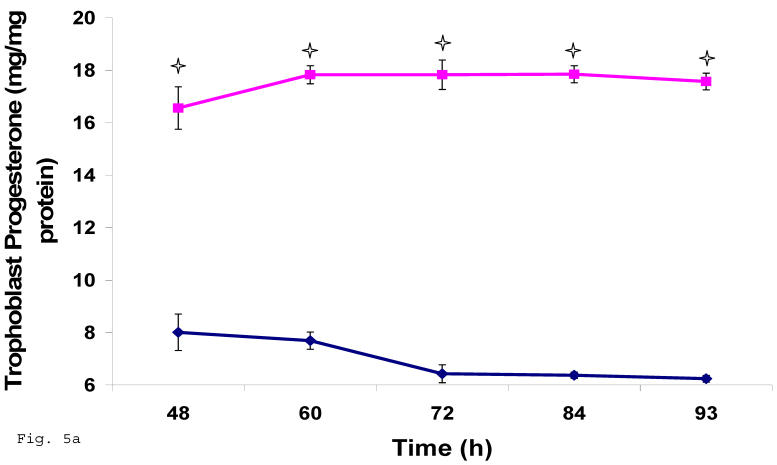
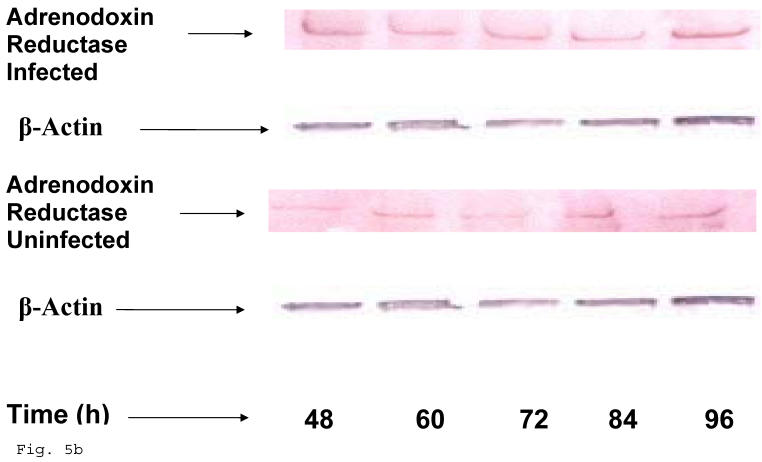
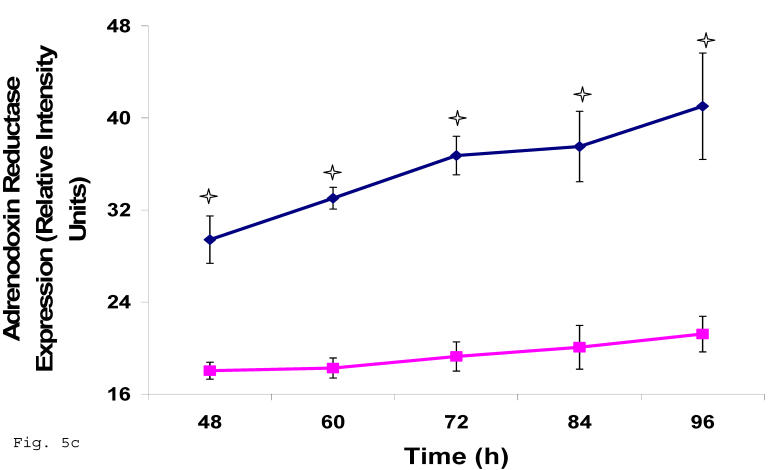
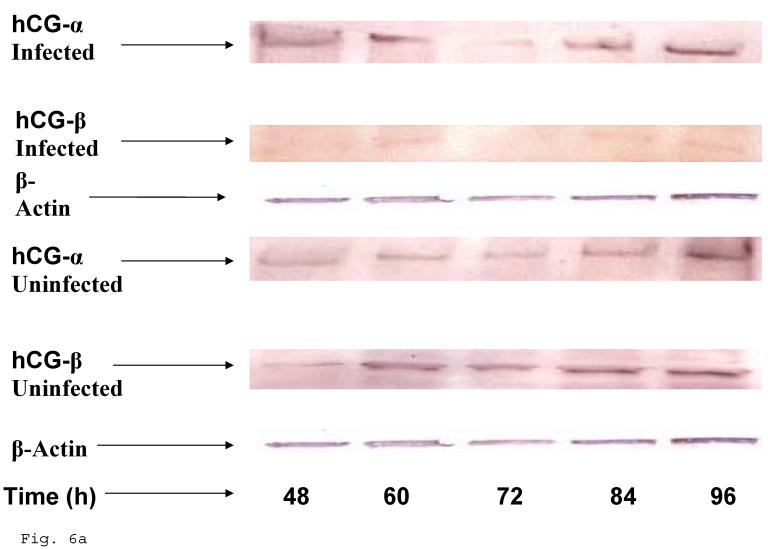
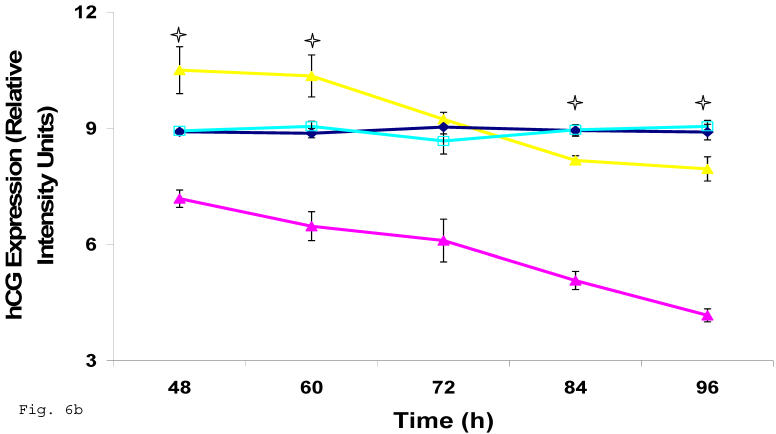
The trophoblast cells are in direct contact with endometrial tissues throughout gestation, playing important early roles in implantation and placentation. The physiologic significance and the operating mechanisms involved in probable altered trophoblast functions following Chlamydia trachomatis infection were investigated to determine if C. trachomatis initiates productive infection in trophoblast, effects of such event on the biosynthesis of cholesterol and its derivatives estrogen and progesterone; and the regulator of the biosynthesis of these hormones, human chorionic gonadotropin. Chlamydia trachomatis exhibited productive infection in trophoblast typified by inclusion formation observed when chlamydia elementary bodies were harvested from trophoblast and titrated onto HEp-2 cells. Assessment of the status of C. trachomatis in trophoblast showed a relative increase in protein of HSP-60 compared with MOMP, features suggestive of chlamydial chronicity. There was a decrease in cellular cholesterol of chlamydia infected trophoblast and a down regulation of HMG-CoA reductase. The levels of estrogen and progesterone were decreased, while the expression of aromatase and adrenodoxin reductase was up regulated. Also, there was a decrease in human chorionic gonadotropin expression. The implications of these findings are that C. trachomatis infection of trophoblast may compromise cellular cholesterol biosynthesis, thus depleting the substrate pool for estrogen and progesterone synthesis. This defect may impair trophoblast functions of implantation and placentation, and consequently affect pregnancy sequelae.

Keywords: Chlamydia and pregnancy outcome; Chronic chlamydia in trophoblast; Steroid hormones; Trophoblast function.


Conflict of interest statement

Conflict of interest: The authors have declared that no conflict of interest exists.

Figures

Fig 1
Fig 1
Induction of productive infection by Chlamydia trachomatis in trophoblast. The formation of Chlamydia trachomatis inclusion (MOI = 3/cell) in trophoblast (A) compared with direct infection of HEp-2 cells (B) is represented. Experimental procedure was repeated three times. Panel (A) indicates HEp-2 cell infection with Chlamydia trachomatis that has been harvested from trophoblast cell line JAR and titrated onto HEp-2 cells. Panel (B) shows a direct infection of HEp-2 cells with Chlamydia trachomatis. Notice the relative suppression of Chlamydia trachomatis growth in trophoblast. The arrows indicate Chlamydia trachomatis inclusion bodies. However, the Chlamydia trachomatis harvested from trophoblast were able to efficiently infect HEp-2 cells (productive infection), (C) although there is a significant difference (p < 0.01 *) in IFU/ml when Chlamydia trachomatis harvested from trophoblast are compared with regular EBs in our laboratory are used to infect HEp-2 cells (C). Further, percent infectivity of HEp-2 cells is shown in (D). There is a significant difference (p < 0.01 *) between direct infection of HEp-2 cells (red) and infection of HEp-2 cells with Chlamydia trachomatis harvested from trophoblast. All values represent means ± SEM (n = 3).
Fig 1
Fig 1
Induction of productive infection by Chlamydia trachomatis in trophoblast. The formation of Chlamydia trachomatis inclusion (MOI = 3/cell) in trophoblast (A) compared with direct infection of HEp-2 cells (B) is represented. Experimental procedure was repeated three times. Panel (A) indicates HEp-2 cell infection with Chlamydia trachomatis that has been harvested from trophoblast cell line JAR and titrated onto HEp-2 cells. Panel (B) shows a direct infection of HEp-2 cells with Chlamydia trachomatis. Notice the relative suppression of Chlamydia trachomatis growth in trophoblast. The arrows indicate Chlamydia trachomatis inclusion bodies. However, the Chlamydia trachomatis harvested from trophoblast were able to efficiently infect HEp-2 cells (productive infection), (C) although there is a significant difference (p < 0.01 *) in IFU/ml when Chlamydia trachomatis harvested from trophoblast are compared with regular EBs in our laboratory are used to infect HEp-2 cells (C). Further, percent infectivity of HEp-2 cells is shown in (D). There is a significant difference (p < 0.01 *) between direct infection of HEp-2 cells (red) and infection of HEp-2 cells with Chlamydia trachomatis harvested from trophoblast. All values represent means ± SEM (n = 3).
Fig 2
Fig 2
HSP-60 shedding by Chlamydia trachomatis during infection of trophoblast. The shedding of Chlamydia trachomatis HSP-60 compared with MOMP during infection of trophoblast is depicted (A). There is time-course increase in Chlamydia trachomatis HSP-60 protein (-■-) with a peak at 72 h (B) compared with MOMP (-♦-) (p < 0.01 * ). Additionally, Chlamydia trachomatis HSP-60 shedding and MOMP expression is also shown in direct infection of HEp-2 cells (C). HSP-60 expression slowly decreases over time (-▲-), whereas MOMP (-x-) expression shows a time-course increase to 84 h before declining at 96 h (p < 0.05 *). All values represent means ± SEM (n = 3).
Fig 2
Fig 2
HSP-60 shedding by Chlamydia trachomatis during infection of trophoblast. The shedding of Chlamydia trachomatis HSP-60 compared with MOMP during infection of trophoblast is depicted (A). There is time-course increase in Chlamydia trachomatis HSP-60 protein (-■-) with a peak at 72 h (B) compared with MOMP (-♦-) (p < 0.01 * ). Additionally, Chlamydia trachomatis HSP-60 shedding and MOMP expression is also shown in direct infection of HEp-2 cells (C). HSP-60 expression slowly decreases over time (-▲-), whereas MOMP (-x-) expression shows a time-course increase to 84 h before declining at 96 h (p < 0.05 *). All values represent means ± SEM (n = 3).
Fig 3
Fig 3
Chlamydia trachomatis induces changes in cholesterol biosynthesis. The levels of cellular cholesterol in infected trophoblast (-♦-) compared with uninfected (-■-) trophoblast is depicted. There was an initial increase in cholesterol level which was significant (p < 0.05 *) and was followed by a decline (A). Protein expression (B & C) of HMG-CoA Reductase (the rate-limiting enzyme of cholesterol biosynthesis) was decreased in infected trophoblasts (-♦-) compared with uninfected trophoblasts (-■-) (p < 0.05 *). All values represent means ± SEM (n = 3).
Fig 3
Fig 3
Chlamydia trachomatis induces changes in cholesterol biosynthesis. The levels of cellular cholesterol in infected trophoblast (-♦-) compared with uninfected (-■-) trophoblast is depicted. There was an initial increase in cholesterol level which was significant (p < 0.05 *) and was followed by a decline (A). Protein expression (B & C) of HMG-CoA Reductase (the rate-limiting enzyme of cholesterol biosynthesis) was decreased in infected trophoblasts (-♦-) compared with uninfected trophoblasts (-■-) (p < 0.05 *). All values represent means ± SEM (n = 3).
Fig 4
Fig 4
Induction of estradiol down-regulation in Chlamydia trachomatis infected trophoblast. The cellular estradiol level of infected trophoblast (-♦-) compared with uninfected cells (-■-) is depicted (A). There was significant decline in estradiol production (p < 0.01 * ) in infected trophoblast. The time-course level of aromatase production is represented in B & C. There was a significant increase in expression of the enzyme (p < 0.05 *) in infected trophoblast (-♦-) compared with uninfected trophoblast (-■-). All values represent means ± SEM (n = 3).
Fig 4
Fig 4
Induction of estradiol down-regulation in Chlamydia trachomatis infected trophoblast. The cellular estradiol level of infected trophoblast (-♦-) compared with uninfected cells (-■-) is depicted (A). There was significant decline in estradiol production (p < 0.01 * ) in infected trophoblast. The time-course level of aromatase production is represented in B & C. There was a significant increase in expression of the enzyme (p < 0.05 *) in infected trophoblast (-♦-) compared with uninfected trophoblast (-■-). All values represent means ± SEM (n = 3).
Fig 5
Fig 5
Induction of Progesterone down-regulation in Chlamydia trachomatis infected trophoblast. The level of progesterone in trophoblast infected with Chlamydia trachomatis is shown in A. There was a significant (p < 0.01 *) decline in progesterone production in Chlamydia trachomatis infected cells (-♦-) compared with uninfected cells (-■-). The levels of adrenodoxin reductase are depicted in B & C. There was a significant (p < 0.01 *) up-regulation of enzyme in infected cells (-♦-) compared with uninfected cells (-■-). All values represent means ± SEM (n = 3).
Fig 5
Fig 5
Induction of Progesterone down-regulation in Chlamydia trachomatis infected trophoblast. The level of progesterone in trophoblast infected with Chlamydia trachomatis is shown in A. There was a significant (p < 0.01 *) decline in progesterone production in Chlamydia trachomatis infected cells (-♦-) compared with uninfected cells (-■-). The levels of adrenodoxin reductase are depicted in B & C. There was a significant (p < 0.01 *) up-regulation of enzyme in infected cells (-♦-) compared with uninfected cells (-■-). All values represent means ± SEM (n = 3).
Fig 6
Fig 6
Down-regulation of hCG in Chlamydia trachomatis infected trophoblast. The effect of Chlamydia trachomatis on trophoblast hCG production during infection is depicted as hCG protein expression (A and B). Panel A shows reduction in β-hCG in infected trophoblast compared with uninfected cells. Less change was recorded in α-hCG. There was a significant decline (p < 0.05 *) in β-hCG production (B) in infected trophoblast (-x-) compared with uninfected (-■-) while the α-hCG showed no significant difference when Chlamydia trachomatis infected trophoblast (-▲-) is compared with uninfected trophoblast (-♦-). All values represent means ± SEM (n = 3).
Fig 6
Fig 6
Down-regulation of hCG in Chlamydia trachomatis infected trophoblast. The effect of Chlamydia trachomatis on trophoblast hCG production during infection is depicted as hCG protein expression (A and B). Panel A shows reduction in β-hCG in infected trophoblast compared with uninfected cells. Less change was recorded in α-hCG. There was a significant decline (p < 0.05 *) in β-hCG production (B) in infected trophoblast (-x-) compared with uninfected (-■-) while the α-hCG showed no significant difference when Chlamydia trachomatis infected trophoblast (-▲-) is compared with uninfected trophoblast (-♦-). All values represent means ± SEM (n = 3).

References

    1. Bevilacqua E, Abahamsohn P.A. Ultrastructure of trophoblast giant cell transformation during the invasive stage of implantation of the mouse embryo. J. Morphology. 1988;198:341–351. - PubMed
    1. Mehrotra P.K. Ultrastructure of mouse ectoplacental cone cells. Biol. Struct. Morph. 1988;1:63–68. - PubMed
    1. Kanai-Azuma M, Kanai Y, Kurohmaru M, Tachi C, Yazaki K, Hayashi Y. Giant cells transformation of trophoblast cells in mice. Endocrine J. 1994;41:33–41.
    1. Loke YW, King A. Human Implantation. Cambridge: Cambridge University Press; 1995.
    1. Manyonda I.T, Slater D.M, Fenske C, Hole D, Choy M.Y, Wilson C. A role for noradrenaline in pre-eclampsia: towards a unifying hypothesis for the pathophysiology. Br. J. Obstet. Gynaecol. 1998;105:641–648. - PubMed

Publication types