. 2007 Sep;15(9):1040-52.
doi: 10.1016/j.str.2007.06.019.

Ensemble refinement of protein crystal structures: validation and application

Affiliations

Ensemble refinement of protein crystal structures: validation and application

Elena J Levin et al. Structure. 2007 Sep.

Abstract

X-ray crystallography typically uses a single set of coordinates and B factors to describe macromolecular conformations. Refinement of multiple copies of the entire structure has been previously used in specific cases as an alternative means of representing structural flexibility. Here, we systematically validate this method by using simulated diffraction data, and we find that ensemble refinement produces better representations of the distributions of atomic positions in the simulated structures than single-conformer refinements. Comparison of principal components calculated from the refined ensembles and simulations shows that concerted motions are captured locally, but that correlations dissipate over long distances. Ensemble refinement is also used on 50 experimental structures of varying resolution and leads to decreases in R(free) values, implying that improvements in the representation of flexibility observed for the simulated structures may apply to real structures. These gains are essentially independent of resolution or data-to-parameter ratio, suggesting that even structures at moderate resolution can benefit from ensemble refinement.


Figures

Figure 1
Figure 1. Root mean square deviations by residue of the simulated multiple conformer models
The average RMS deviation from the mean coordinates of the MD simulations and the one-, two-, and sixteen-conformer models refined against the simulated data are shown for each residue. All atoms were used in the calculations, and the contributions from both the explicit conformers and the temperature factors were included where appropriate. The RMSD values for the two and sixteen-conformer models and the simulations are shifted by 0.25, 0.5, and 0.75 Å respectively for clarity.
Figure 2
Figure 2. Examples of anharmonic residue probability distributions for the simulated single and multiple conformer models
The panels on the left show images of the electron density maps generated from the MD simulations of 1Q4R, along with the a stick representation of the final sixteen-conformer model. The panels on the left show for the red residues the histograms of the projections of the simulation coordinates along the first principal components in black, as well the probability density functions calculated from the one-conformer (red) and sixteen-conformer (blue) models along the same axis.
Figure 3
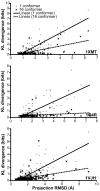
Figure 3. Similarity of simulation and ensemble residue probability distributions as a function of the magnitude of motion
Probability distributions along the primary axis of motion for the simulations and the refined models were calculated for each residue by projecting the coordinate deviation matrices on the simulation left singular vectors, and in the case of the crystallographic models, accounting for the effect of nonzero temperature factors. The KL-divergences of the one- and sixteen-conformer model distributions from the simulation distributions are plotted against the simulation distributions’ standard deviations. Black points correspond to the one-conformer models for each protein, and red points to the sixteen-conformer models. The solid lines are the lines of best fit for each model.
Figure 4
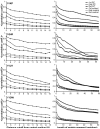
Figure 4. Similarity between left singular vectors of multiple conformer models and simulations for residue subsets of increasing size
Overlapping clusters of residues were defined in two different ways: (a) for each residue in the protein, every residue whose arithmetic center over the course of the simulation was within a variable distance from its center, and (b) every possible substring of the protein sequence up to either half the length of the backbone, or at maximum sixty residues. Singular value decomposition was performed on the coordinates of all atoms in each cluster from the simulation frames and from the sixteen conformer models. The absolute values of the correlation coefficients between the LSVs of the two models were then averaged over every cluster with the same radius/length in the protein. The left panels represent clusters defined by distance cutoff, and the right panels clusters for the same protein defined by sequence.
Figure 5
Figure 5. Effect of observation to parameter ratio on the improvement in R-free from ensemble refinement
The decrease in R-free between the initial R-free and the R-free of the best performing multiple conformer model for 49 of the 50 experimental structures is plotted as a function of the ratio of the number of reflections used in refinement to the number of atoms in the original one conformer structure.
Figure 6
Figure 6. Electron density calculated with model phases obtained from single-conformer and ensemble structures
2Fo-Fc maps were calculated for the structure 1VJH using phases from the original single conformer model (A) and the sixteen conformer model (B). Both maps are shown at 0.5 σ.
Figure 7
Figure 7. Root mean square deviations by residue of experimental multiple conformer models
The average RMS deviation from the mean coordinates of the one-, two-, and sixteen-conformer models refined against experimental X-ray data are shown for each residue. All atoms were used in the calculations, and the contributions from both the explicit conformers and the temperature factors were included where appropriate. The RMSD values for the two and sixteen-conformer models are shifted by 0.25 and 0.5 Å respectively for clarity.
Figure 8
Figure 8. Reproducibility of left singular vectors of multiple conformer models for residue subsets of increasing size over multiple refinements
Overlapping clusters of residues were defined in two different ways: (a) for each residue in the protein, every residue whose arithmetic center over all conformers of the multiple conformer model was within a variable distance from its center, and (b) every possible substring of the protein sequence up to either half the length of the backbone, or at maximum sixty residues. Singular value decomposition was performed on the coordinates of all atoms in each cluster from two sixteen conformer models generated with different initial velocities in the simulated annealing step of refinement. The absolute values of the correlation coefficients between the LSVs of the two models were then averaged over every cluster with the same radius/length in the protein. The left panels represent clusters defined by distance cutoff, and the right panels clusters for the same protein defined by sequence.

References

    1. Abbondanzieri EA, Greenleaf WJ, Shaevitz JW, Landick R, Block SM. Direct observation of base-pair stepping by RNA polymerase. Nature. 2005;438:460–465. - PMC - PubMed
    1. Ansari A, Berendzen J, Bowne SF, Frauenfelder H, Iben IE, Sauke TB, Shyamsunder E, Young RD. Protein states and proteinquakes. Proc Natl Acad Sci U S A. 1985;82:5000–5004. - PMC - PubMed
    1. Austin RH, Beeson KW, Eisenstein L, Frauenfelder H, Gunsalus IC. Dynamics of ligand binding to myoglobin. Biochemistry. 1975;14:5355–5373. - PubMed
    1. Brunger AT, Adams PD, Clore GM, DeLano WL, Gros P, Grosse-Kunstleve RW, Jiang JS, Kuszewski J, Nilges M, Pannu NS, et al. Crystallography & NMR system: A new software suite for macromolecular structure determination. Acta Crystallogr D Biol Crystallogr. 1998;54:905–921. - PubMed
    1. Burling FT, Brunger AT. Thermal Motion and Conformational Disorder in Protein Crystal-Structures - Comparison of Multi-Conformer and Time-Averaging Models. Israel Journal of Chemistry. 1994;34:165–175.

Publication types

LinkOut - more resources