. 2007 Oct 3;26(19):4252-62.
doi: 10.1038/sj.emboj.7601853. Epub 2007 Sep 13.

The coupling of synthesis and partitioning of EBV's plasmid replicon is revealed in live cells

Affiliations

The coupling of synthesis and partitioning of EBV's plasmid replicon is revealed in live cells

Asuka Nanbo et al. EMBO J. .

Abstract

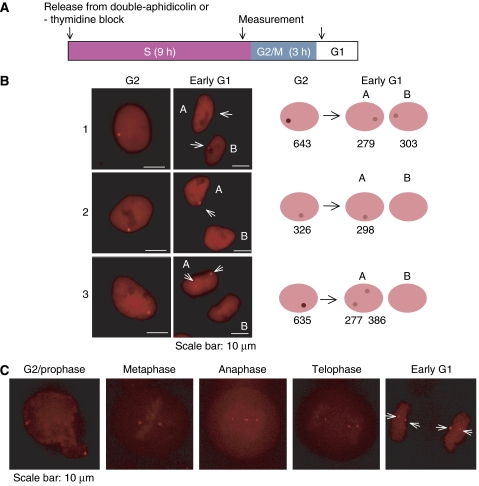
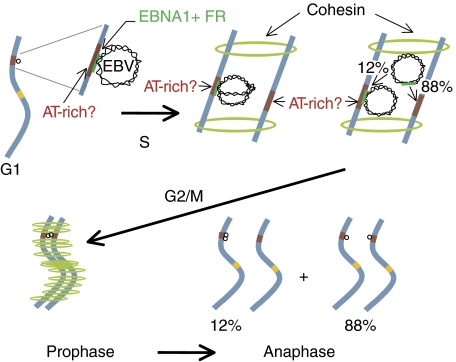
Epstein-Barr virus (EBV) is an exceptionally successful human viral pathogen maintained as a licensed, plasmid replicon in proliferating cells. We have measured the distributions of EBV-derived plasmids in single live cells throughout the cell cycle in the absence of selection and confirmed the measured rates of duplication and partitioning computationally and experimentally. These analyses have uncovered a striking, non-random partitioning for this minimalist plasmid replicon and revealed additional properties of it and its host cells: (1) 84% of the plasmids duplicate during each S phase; (2) all duplicated plasmids are spatially colocalized as pairs, a positioning that is coupled to their non-random partitioning; (3) each clone of cells requires a certain threshold number of plasmids per cell for its optimal growth under selection; (4) defects in plasmid synthesis and partitioning are balanced to yield wide distributions of plasmids in clonal populations of cells for which the plasmids provide a selective advantage. These properties of its plasmid replicon underlie EBV's success as a human pathogen.


Figures

Figure 1
Figure 1
Visualization of EBV-derived plasmids in live cells. (A) A map of an EBV-derived plasmid (pLON-33K). pLON-33K contains oriP, 264 copies of LacO, and a neomycin-resistance gene (neoR). OriP consists of two functional elements, a family of repeats (FR), and a Dyad Symmetry (DS), which contain 20 and 4 EBNA1-binding sites, respectively. (B) Two independent HeLa-EBNA1 clones carrying on average 3–4 copies of pLON-33K plasmids per cell (clones A and B) were isolated. The distributions of the viral plasmids in these clones were measured after treatment with aphidicolin, either by FISH (gray bars) or by live-cell imaging (blue bars). The average copy numbers of EBV plasmids with their standard deviations are shown. The distributions of the plasmids in the cell populations measured by the two assays are overlapping, thus confirming the utility of the live-cell assay.
Figure 2
Figure 2
Time-lapse analysis of EBV-derived plasmids in synchronized cells. (A) A scheme of the experiment to measure partitioning. HeLa-EBNA-1 clones carrying viral plasmids were synchronized by double-aphidicolin or double-thymidine block in the presence of 10 μM IPTG and 600 μg/ml G418. After removal of IPTG and G418, the cells were released from a second block and incubated for 9 h (S phase) and a subsequent 3 h (G2/M phase). The distributions of 370 plasmids in 106 mitoses (1∼13 plasmids/cell in G2) were characterized by the measurement of the number of dots and the average fluorescent intensities in individual dots in G2 and early in G1. Only cells judged as being healthy by their successful completion of mitosis and having intact peripheries without blebs were studied. (B) Examples of the distributions of pLON-33K in G2 and early in G1. The distributions of the viral plasmids in G2 and early in G1 are categorized into the following three types: (1) plasmids were present as colocalized pairs in G2 and partitioned equally following mitosis; (2) plasmids were localized as single molecules in G2 and partitioned randomly following mitosis; (3) plasmids were present as a colocalized pair in G2 and segregated to only one daughter cell. In these examples, the measured intensities of each signal after correcting for the background are shown under the drawing of each cell to the right. Bars, 10 μm. The varied intensities of the backgrounds in the nuclei likely reflect different levels of expression of wtLacI-tdRFP in them. (C) Spatial–temporal analysis of the segregation of pLON-33K during mitosis. The distribution of the plasmids at each stage of mitosis is shown. Two pairs of colocalized plasmids were segregated at the onset of anaphase, and distributed equally to the daughter cells. Bar, 10 μm.
Figure 3
Figure 3
Time-lapse analysis of EBV-derived plasmids in unsynchronized cells. (A) A scheme of the experiment to follow plasmids throughout the cell cycle is shown. After removal of selection HeLa-EBNA1, clones carrying pLON-33K early in G1 were incubated for 12 h (G1) in the presence of 10μg/ml IPTG. After removal of IPTG, the cells were incubated for 9 h (S phase) and 3 h (G2/M phase). The distributions of 18 plasmids in 11 cells (1∼2 plasmids/cell in G2) were characterized by the measurements of the number of dots and the average fluorescent intensities in individual dots late in G1, late in S, and subsequently early in G1. (B) Time-lapse analysis of the average fluorescent intensities of pLON-33K plasmids throughout cell cycle. Representative images of the following two types of the partitioning of the plasmid are shown: (1) the plasmids synthesized in one S phase are colocalized and partitioned faithfully and (2) the plasmids that fail to be replicated in one S phase can not be partitioned faithfully. The top row of images reflects the single z-stack with the most intense signal, from which the intensities were measured and corrected for background. The second row of images reflects deconvolved signals, which are computationally derived and are an indication of the size of the signal. The third row of images is derived by differential interference contrast (DIC) and illustrates the health of the cells. The fourth row are cartoon images giving the average fluorescent intensities of the signals measured late in G1, late in S, and early in G1 after correction for their background is shown under the drawing of each cell. Bars, 10 μm.
Figure 4
Figure 4
Computer simulations predict the distributions of EBV-derived plasmids in proliferating cells in the absence of selection. (A) A clone of HeLa-EBNA1 cells carrying pLON-33K was cultured after removing the selective agent, G418, for 25 generations. The distributions of the plasmids in the cells before removing G418, day 0, and at day 10, and day 25 after its removal were determined by live-cell imaging (green bars). The distributions of the plasmids in the cells were also predicted (red bars) by computer simulations in which the measured distribution at day 0 was used as the starting point, and the rates of plasmid duplication and partitioning determined experimentally (Figures 2 and 3; and Table I) were used to predict the distribution of the plasmids each cell generation. The computer simulations were repeated 40 times and averaged to provide the smooth curves shown. (B) A clone of 293 cells carrying the intact EBV genome encoding resistance to hygromycin B was cultured after removing the selective agent for 25 generations. The distributions of the plasmids in the cells before removing hygromycin B, day 0, and at day 10, and day 25 after its removal was determined by FISH (green bars) and predicted (red bars) as described above. The average number of plasmids per cell and its standard deviation are shown for each condition.
Figure 5
Figure 5
Computer simulations predict the distribution of EBV genomes in transformed B-cells. A clone of EBV-transformed B-cells, 721, propagated for more than 100 generations, and four of its subclones propagated for approximately 25 generations were analyzed after being blocked in S phase with aphidicolin or in M phase with nocodazole, for their distributions of EBV plasmids per cell by FISH. The average number of plasmids per cell and its standard deviation are shown for each condition. The average numbers of plasmids per cell in all five populations were similar, indicating that there is a genetically determined average number of plasmids per cell that provides the cells an optimal selective advantage. The distribution of plasmids per cell in the parental 721 cells was used as a starting point to simulate the distributions of plasmids in cells after 25 generations. The simulations were modified to include an increasing chance of cells' dying when their number of plasmids decreased from 4 to 0 per cell. These simulated values (red bars) were comparable to the average of the measured values of the four subclones (gray bars).
Figure 6
Figure 6
A model for the licensed duplication and non-random partitioning of EBV plasmids. In G1, EBV plasmids are tethered to chromosomes by EBNA1 binding to FR of oriP and possibly to AT-rich chromosomal sites by EBNA1's AT-hook activity. Duplication of a plasmid is approximately synchronous with that of the chromosomal site to which it is tethered, because the shared location brings both to one replication compartment synchronously. Cohesin holds the newly synthesized chromatids in close proximity so that on the plasmid's eventual release from FR following a ‘stalled fork progression' through FR, in 88% of the cases the duplicated plasmids bind to the duplicated sites on the adjacent sister chromatids. Their close proximity means that their fluorescent detection yields one single, but double-intensity, signal until they separate at anaphase.

Similar articles

Cited by

References

    1. Altmann M, Pich D, Ruiss R, Wang J, Sugden B, Hammerschmidt W (2006) Transcriptional activation by EBV nuclear antigen 1 is essential for the expression of EBV's transforming genes. Proc Natl Acad Sci USA 103: 14188–14193 - PMC - PubMed
    1. Bashaw JM, Yates JL (2001) Replication from oriP of Epstein–Barr virus requires exact spacing of two bound dimers of EBNA1 which bend DNA. J Virol 75: 10603–10611 - PMC - PubMed
    1. Campbell RE, Tour O, Palmer AE, Steinbach PA, Baird GS, Zacharias DA, Tsien RY (2002) A monomeric red fluorescent protein. Proc Natl Acad Sci USA 99: 7877–7882 - PMC - PubMed
    1. Chaudhuri B, Xu H, Todorov I, Dutta A, Yates JL (2001) Human DNA replication initiation factors, ORC and MCM, associate with oriP of Epstein–Barr virus. Proc Natl Acad Sci USA 98: 10085–10089 - PMC - PubMed
    1. Chow LT, Broker TR (2006) Papillomavirus. In DNA Replication and Human Disease, DePamphilis ML (ed), pp 609–625. Cold Spring Harbor, New York, USA: Cold Spring Harbor Press

Publication types