. 2007 Oct;117(10):2847-59.
doi: 10.1172/JCI31008.

TLR4 activation mediates kidney ischemia/reperfusion injury

Affiliations

TLR4 activation mediates kidney ischemia/reperfusion injury

Huiling Wu et al. J Clin Invest. 2007 Oct.

Abstract

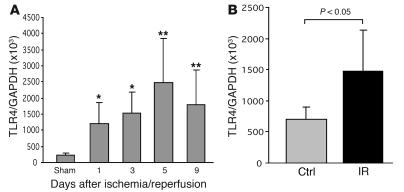
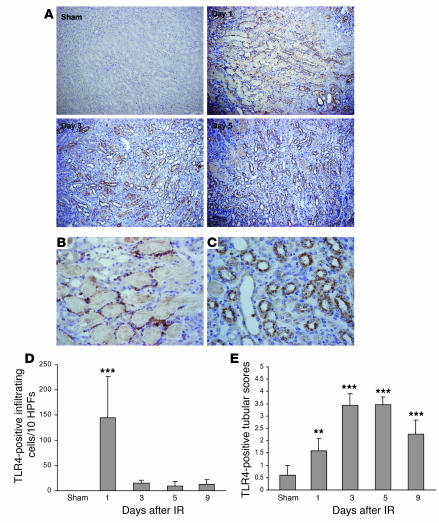
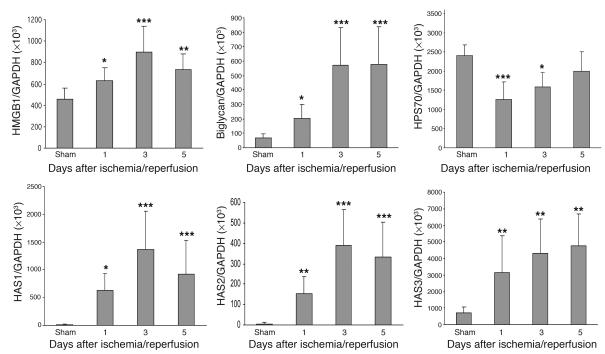
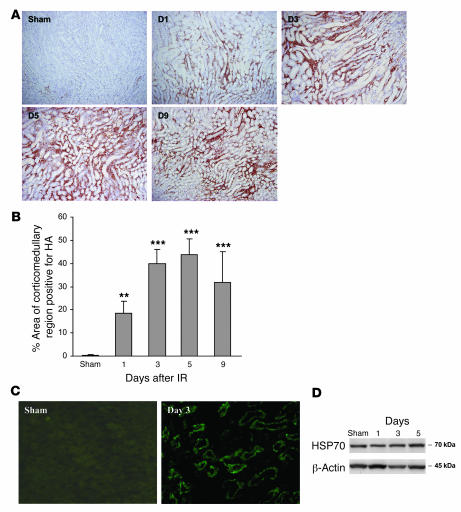
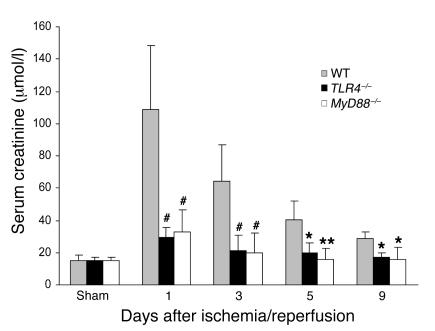
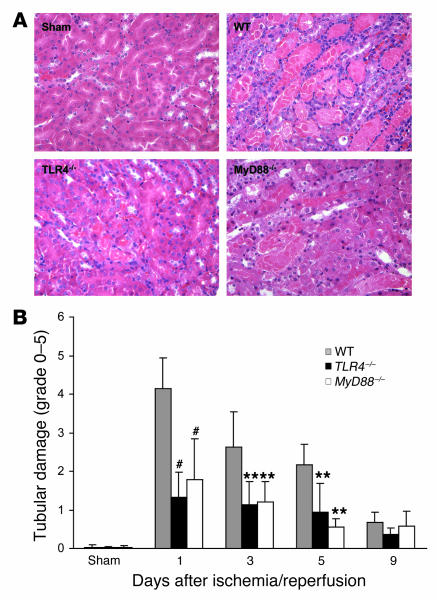
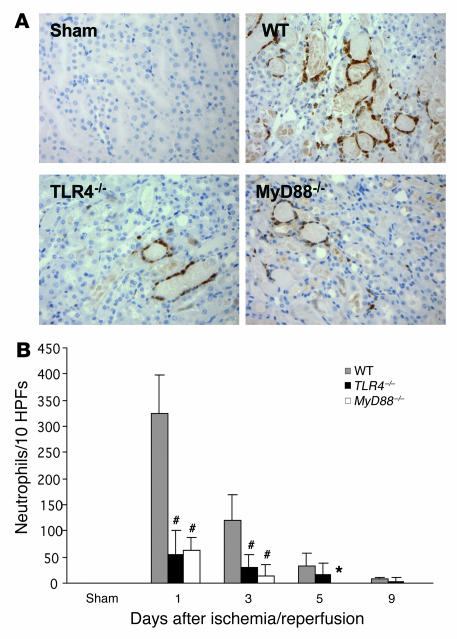
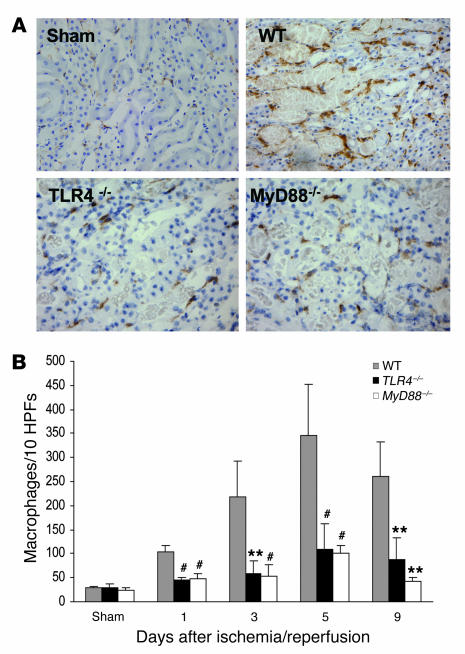
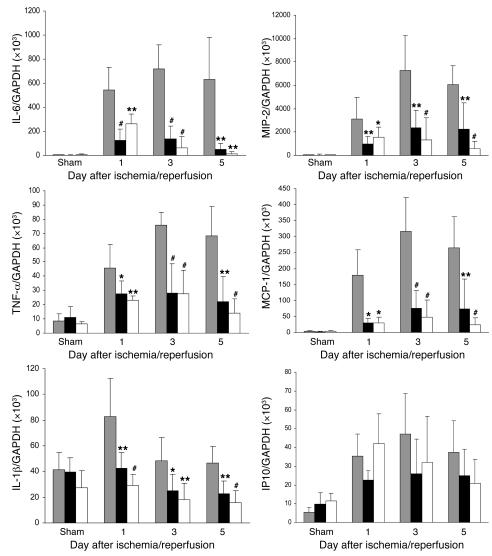
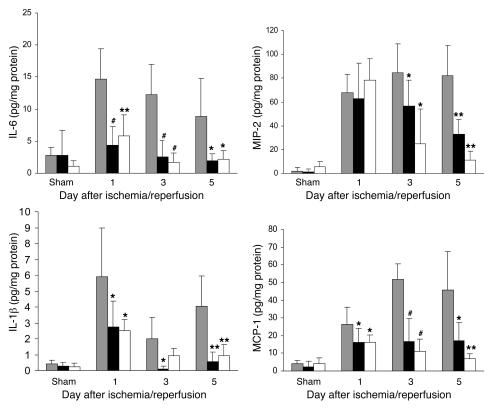
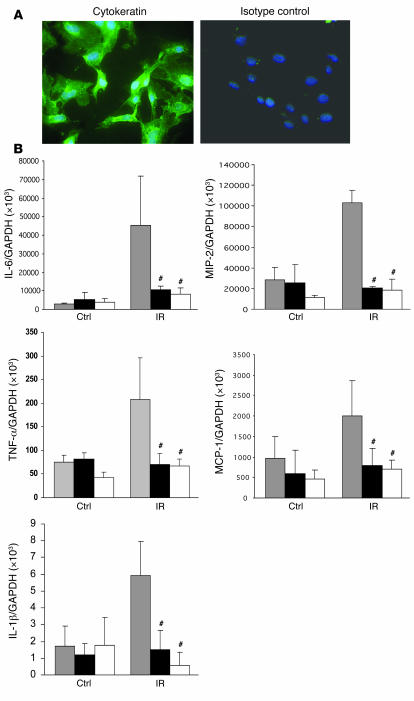
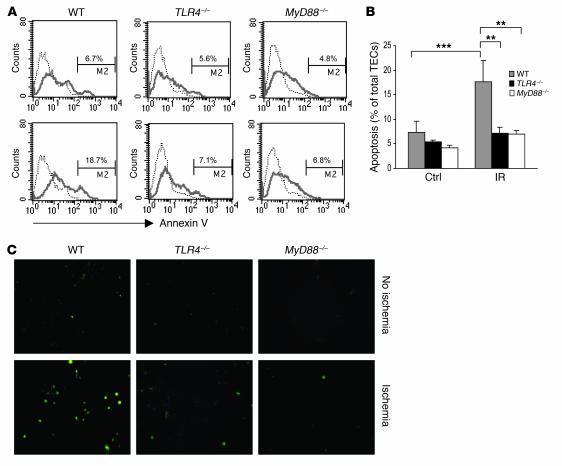
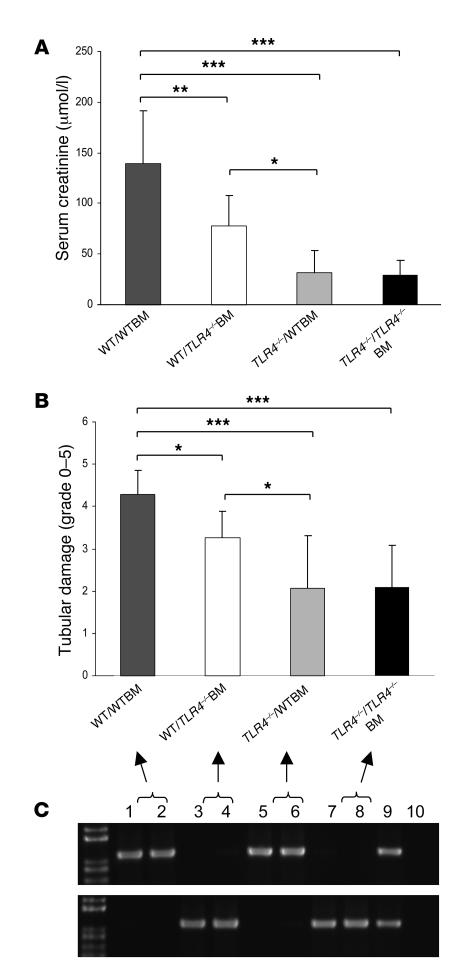
Ischemia/reperfusion injury (IRI) may activate innate immunity through the engagement of TLRs by endogenous ligands. TLR4 expressed within the kidney is a potential mediator of innate activation and inflammation. Using a mouse model of kidney IRI, we demonstrated a significant increase in TLR4 expression by tubular epithelial cells (TECs) and infiltrating leukocytes within the kidney following ischemia. TLR4 signaling through the MyD88-dependent pathway was required for the full development of kidney IRI, as both TLR4(-/-) and MyD88(-/-) mice were protected against kidney dysfunction, tubular damage, neutrophil and macrophage accumulation, and expression of proinflammatory cytokines and chemokines. In vitro, WT kidney TECs produced proinflammatory cytokines and chemokines and underwent apoptosis after ischemia. These effects were attenuated in TLR4(-/-) and MyD88(-/-) TECs. In addition, we demonstrated upregulation of the endogenous ligands high-mobility group box 1 (HMGB1), hyaluronan, and biglycan, providing circumstantial evidence that one or more of these ligands may be the source of TLR4 activation. To determine the relative contribution of TLR4 expression by parenchymal cells or leukocytes to kidney damage during IRI, we generated chimeric mice. TLR4(-/-) mice engrafted with WT hematopoietic cells had significantly lower serum creatinine and less tubular damage than WT mice reconstituted with TLR4(-/-) BM, suggesting that TLR4 signaling in intrinsic kidney cells plays the dominant role in mediating kidney damage.


Figures

Figure 1
Figure 1. TLR4 mRNA expression is increased following ischemia/reperfusion.
(A) Ischemia-induced upregulation of TLR4 mRNA expression in the kidney (n = 6–8) from day 1 to day 9 after IRI compared with sham-operated controls. n = 6–8. (B) TECs submitted to ischemia expressed significantly higher levels of mRNA for TLR4 than controls. P < 0.05. mRNA expression was measured by real-time PCR. The results have been normalized by expressing the number of transcript copies as a ratio to GAPDH. Data are mean ± SD. Ctrl, control; IR, ischemia/reperfusion. *P < 0.05; **P < 0.01.
Figure 2
Figure 2. TLR protein expression is increased in the kidney following ischemia/reperfusion.
(A) Immunostaining demonstrated that TLR4 protein was expressed by infiltrating cells and TECs at day 1 and then predominantly expressed by TECs on days 3, 5, and 9 after IRI. Original magnification, ×200. (B) TLR4 was expressed by intrarenal leukocyte cells at day 1 after IRI. Magnification, ×600. (C) TLR4 was expressed by tubular cells at day 5 after IRI. Original magnification, ×600. (D) The number of cells expressing TLR4 dramatically increased on day 1, declining rapidly thereafter. These cells could be resident renal DCs/macrophages or infiltrating leukocytes. (E) Expression levels of TLR4 protein in tubules were significantly increased from day 1 to day 9 after IRI compared with sham-operated controls. **P < 0.01; ***P < 0.001. Data are mean ± SD. n = 6–8 per group.
Figure 3
Figure 3. mRNA expression of endogenous ligands for TLR4 expressed in the IRI kidney by real-time PCR.
mRNA levels for HMGB1, biglycan, and HAS1, -2, and -3 were significantly increased from day 1 to day 5 after IRI, but HSP70 mRNA levels were not increased. Data shown are mean ± SD. n = 7–10 per group. *P < 0.05, **P < 0.01, ***P < 0.001.
Figure 4
Figure 4. IRI induces a marked and progressive increase in interstitial hyaluronan expression in WT mice.
Representative sections of the kidney are stained for hyaluronan (HA) using biotinylated hyaluronan-binding protein (b-HABP) (original magnification, ×200) from day 1 to day 9 after IRI (A). (B) Analysis of HA expression showed that the area of HA-positive staining was significantly increased in the renal interstitium from day 1 to day 9 after IRI compared with sham-operated controls. The comparison between IRI kidney from day 1 to day 9 and sham-operated control is indicated by asterisks. **P < 0.01; ***P < 0.001. (C) Immunofluorescent staining indicates upregulation of HMGB1 expression by TECs at day 3 after IRI compared with sham-operated controls. Original magnification, ×400. (D) Western blot showed that protein expression of HSP70 was not significantly increased in IRI versus sham-operated kidneys.
Figure 5
Figure 5. TLR4–/– (black bars) and MyD88–/–(white bars) mice were protected against renal IRI with significantly lower serum creatinine compared with WT controls (gray bars) from day 1 to day 9 after reperfusion.
Sham-operated mice had normal serum creatinine (10–20 μmol/l). Data are mean ± SD. n = 6–8 per group. The comparison between TLR4–/– mice or MyD88–/– mice and WT controls is indicated by asterisks. *P < 0.05; **P < 0.01; #P < 0.001.
Figure 6
Figure 6. Tubular injury in TLR4–/– and MyD88–/– kidney was significantly less than that seen in kidney from WT mice.
(A) Representative sections of outer medulla from sham-operated, WT, TLR4–/–, and MyD88 –/– mice 1 day after reperfusion (H&E stained). Original magnification, ×200. (B) Semiquantitative analysis of tubular damage in WT (gray bars), TLR4–/– (black bars), and MyD88–/– (white bars) mouse kidney from day 1 to day 9 after reperfusion. Data shown are mean ± SD. n = 6–8 per group. The comparison between TLR4–/– mice or MyD88–/– mice and WT controls is indicated by asterisks. **P < 0.01, #P < 0.001.
Figure 7
Figure 7. Neutrophil accumulation within the interstitium of the kidney was significantly less in TLR4–/– and MyD88–/– mice versus WT controls from day 1 to day 5 after reperfusion.
(A) Representative sections of kidney stained for neutrophils by immunohistochemistry. Original magnification, ×200. (B) Analysis of neutrophil infiltrate in WT (gray bars), TLR4–/– (black bars), and MyD88–/– (white bars) mouse kidney (numbers/10 HPFs). Data shown are mean ± SD. n = 6–8 per group. The comparison between TLR4–/– mice or MyD88–/– mice and WT controls is indicated by asterisks. *P < 0.05; #P < 0.001.
Figure 8
Figure 8. Macrophage accumulation within the interstitium of the kidney was significantly less in TLR4–/– and MyD88–/– mice versus WT controls at all time points (P < 0.05).
(A) Representative sections of the kidney stained for macrophages by immunohistochemistry. Original magnification ×200. (B) Analysis of macrophage infiltrate in WT (gray bars), TLR4–/– (black bars), and MyD88–/– (white bars) mouse kidney (numbers /10 HPFs). Data shown are mean ± SD. n = 6–8 per group. The comparison between TLR4–/– mice or MyD88–/– mice and WT controls is indicated by asterisks. **P < 0.01; #P < 0.001.
Figure 9
Figure 9. Proinflammatory cytokine and chemokine mRNA profile in the kidney measured by real-time PCR.
mRNA expression of proinflammatory cytokines (IL-6, TNF-α, and IL-1β) and chemokines (MIP-2 and MCP-1) in the kidney was significantly reduced in TLR4–/– (black bars) and MyD88–/– (white bars) mice compared with WT controls (gray bars) from day 1 to day 5 after reperfusion. Results have been normalized by expressing the number of transcript copies as a ratio to GAPDH. Data shown are mean ± SD. n = 6–8 per group. The comparison between TLR4–/– mice or MyD88–/– mice and WT controls is indicated by asterisks. *P < 0.05; **P < 0.01, #P < 0.001.
Figure 10
Figure 10. Cytokine and chemokine protein expression in the kidney measured by ELISA.
Protein expression of cytokines (IL-6 and IL-1β) and chemokines (MIP-2 and MCP-1) in the kidney was significantly reduced in TLR4–/– (black bars) and MyD88–/– (white bars) mice compared with WT controls (gray bars) from day 1 to day 5 after reperfusion. *P < 0.05, **P < 0.01, #P < 0.001.
Figure 11
Figure 11. Proinflammatory cytokine and chemokine gene expression in primary cultured TECs submitted to 1 hour ischemia in vitro.
(A) Immunofluorescence staining of primary cultured TECs from C57BL/6 mice with mAbs against cytokeratin (green) and nuclear staining with DAPI in blue. Original magnification, ×400. (B) mRNA expression of proinflammatory cytokines (IL-6, IL-1β, and TNF-α) and chemokines (MIP-2 and MCP-1) in TLR4–/– and MyD88–/– primary cultured TECs submitted to 1 hour ischemia in vitro was significantly reduced at 1 hour after medium replacement as compared with WT controls. The results have been normalized by expressing the number of transcript copies as a ratio to GAPDH. These data are representative of 3 experiments. The comparison between TLR4–/– or MyD88–/– TECs and WT controls is indicated by asterisks. #P < 0.001.
Figure 12
Figure 12. Apoptosis in ischemic TECs was significantly reduced in TLR4–/– and MyD88–/– mice.
(A) Flow cytometric analysis of apoptosis in TECs from WT, TLR4–/–, and MyD88–/– mice (dotted line indicates unstained cells). Numbers represent the percentage of apoptotic cells among propidium iodide–negative, viable cells. TECs subjected to ischemia are represented in the lower panels compared with nonischemic controls in the upper panels. (B) In WT mice, the proportion of apoptotic cells increased from 6.7% to 18.7% after ischemia. In contrast, the proportion of apoptotic cells did not increase significantly in TLR4–/– and MyD88–/– TECs. Data are representative of 2 separate experiments in triplicate and are shown as mean ± SD. **P < 0.01; *** P < 0.001. (C) Apoptosis was further confirmed using a TUNEL assay. TECs subjected to ischemia are shown in the lower panels, with nonischemic controls in the upper panels. Original magnification, ×200.
Figure 13
Figure 13. Functional TLR4 on intrinsic kidney cells makes the more significant contribution to kidney damage.
WT/WTBM mice showed significant kidney dysfunction and injury at day 1 after ischemia/reperfusion, while TLR4–/–/TLR4–/–BM chimeric mice were protected from kidney IRI as measured by day 1 serum creatinine (A) and tubular damage (B). Creatinine levels and tubular injury scores replicated those observed in WT and TLR4–/– mice (Figures 5 and 6), excluding an effect of the BM transplant procedure per se on the response to renal ischemia. Moreover, TLR4–/–/WTBM chimeras were protected from kidney IRI to the same degree as TLR4–/–/TLR4–/–BM mice, while WT/TLR4–/–BM mice enjoyed only partial protection as assessed by day 1 serum creatinine and tubular damage (A and B). Data shown are mean ± SD. n = 7–10 per group. *P < 0.05, **P < 0.01, *** P < 0.001. Full replacement of hematopoietic cells in the chimeric mice was confirmed by genotyping of genomic DNA from whole blood using PCR. PCR products shown on representative gels (C). The top panel represents PCR products for the WT allele DNA, and the bottom panel represents PCR products for the mutated allele DNA (lanes 1–2: WT/WTBM; lanes 3–4: WT/TLR4–/–BM; lanes 5–6: TLR4–/–/WTBM; lanes 7–8: TLR4–/–/ TLR4–/–BM; lane 9: TLR4 heterozygous blood as positive controls; and lane 10: negative controls).

Similar articles

Cited by

References

    1. Herrero-Fresneda I., et al. Do alloreactivity and prolonged cold ischemia cause different elementary lesions in chronic allograft nephropathy? Am. J. Pathol. 2003;162:127–137. - PMC - PubMed
    1. Tilney N.L., Guttmann R.D. Effects of initial ischemia/reperfusion injury on the transplanted kidney. Transplantation. 1997;64:945–947. - PubMed
    1. Chapman J.R., O’Connell P.J., Nankivell B.J. Chronic renal allograft dysfunction. J. Am. Soc. Nephrol. 2005;16:3015–3026. - PubMed
    1. Bonventre J.V., Zuk A. Ischemic acute renal failure: an inflammatory disease? Kidney Int. 2004;66:480–485. - PubMed
    1. Jo S.K., Sung S.A., Cho W.Y., Go K.J., Kim H.K. Macrophages contribute to the initiation of ischaemic acute renal failure in rats. Nephrol. Dial. Transplant. 2006;21:1231–1239. - PubMed

Publication types

MeSH terms