. 2007;35(18):e119.
doi: 10.1093/nar/gkm662. Epub 2007 Sep 13.

Genomic profiling of CpG methylation and allelic specificity using quantitative high-throughput mass spectrometry: critical evaluation and improvements

Affiliations

Genomic profiling of CpG methylation and allelic specificity using quantitative high-throughput mass spectrometry: critical evaluation and improvements

Marcel W Coolen et al. Nucleic Acids Res. 2007.

Abstract

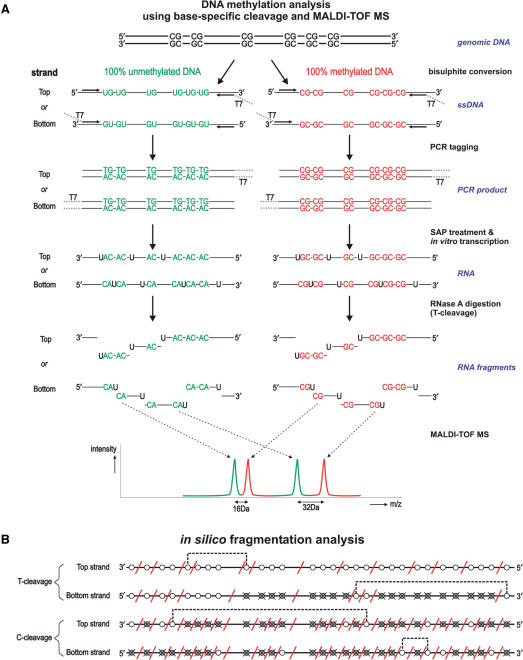
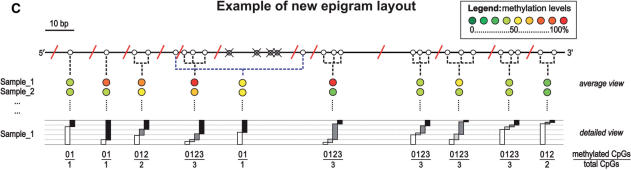
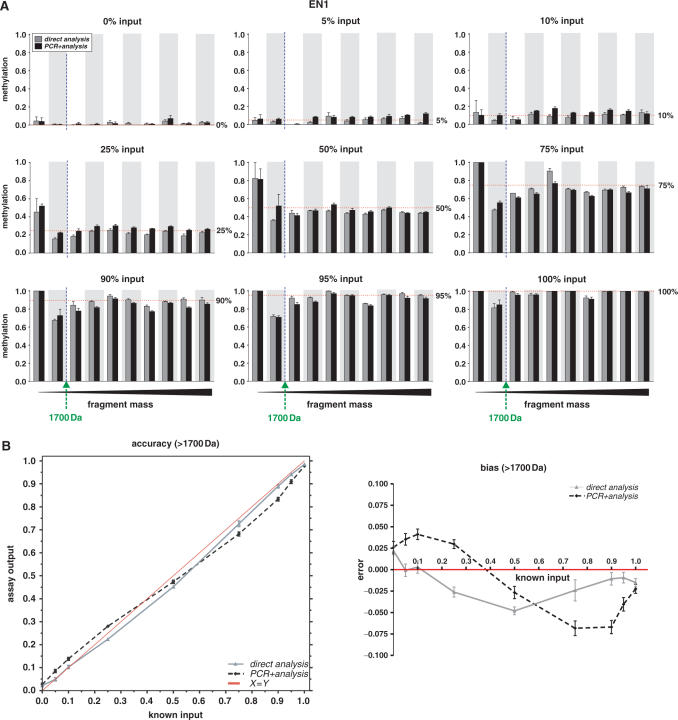
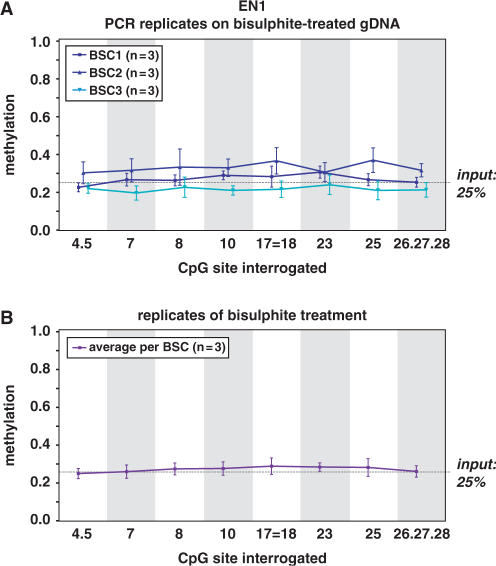
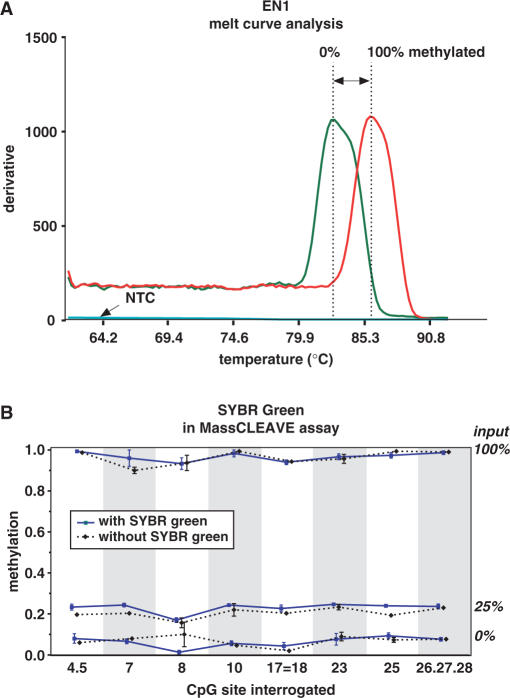
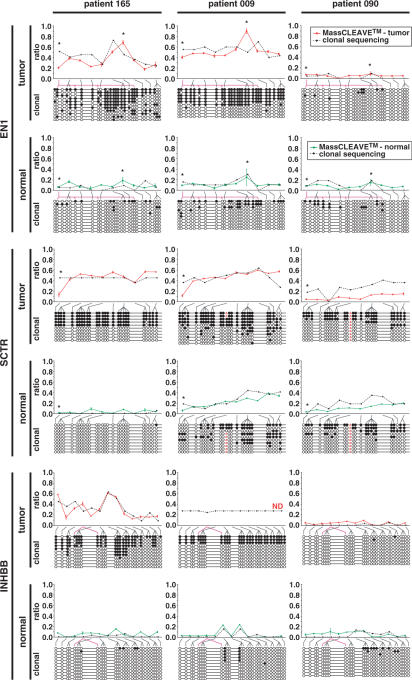
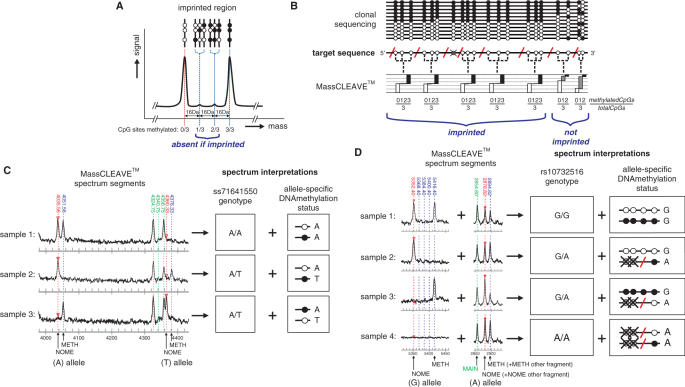
CpG methylation is a key component of the epigenome architecture that is associated with changes in gene expression without a change to the DNA sequence. Since the first reports on deregulation of DNA methylation, in diseases such as cancer, and the initiation of the Human Epigenome Project, an increasing need has arisen for a detailed, high-throughput and quantitative method of analysis to discover and validate normal and aberrant DNA methylation profiles in large sample cohorts. Here we present an improved protocol using base-specific fragmentation and MALDI-TOF mass spectrometry that enables a sensitive and high-throughput method of DNA methylation analysis, quantitative to 5% methylation for each informative CpG residue. We have determined the accuracy, variability and sensitivity of the protocol, implemented critical improvements in experimental design and interpretation of the data and developed a new formula to accurately measure CpG methylation. Key innovations now permit determination of differential and allele-specific methylation, such as in cancer and imprinting. The new protocol is ideally suitable for detailed DNA methylation analysis of multiple genomic regions and large sample cohorts that is critical for comprehensive profiling of normal and diseased human epigenomes.


Figures

Figure 1.
Figure 1.
MALDI-TOF-MS DNA methylation analysis. Overview of the MassCLEAVE™ assay. (A) Genomic DNA is bisulphite treated and PCR-tagged to include the T7 promoter sequence. As shown, either top or bottom strand can be used for amplification. Subsequent alkaline phosphatase (SAP) treatment, in vitro transcription using T7 R&DNA polymerase and a specific nucleotide mixture plus RNase A cleavage results in specific fragmentation. As exemplified, the top and bottom strands can have markedly different fragmentation patterns. The obtained mixture of fragments can be analyzed by MALDI-TOF-MS. Spectrum peaks representing methylated and unmethylated fragments are used to calculate methylation levels for every fragment. (B) In silico transcript fragmentation. The use of T- or C-cleavage mixtures on either the top or bottom strand of bisulphite-treated DNA can yield quite different fragmentation patterns. Here, the fragmentation of the CpG island of INHBB (chr2:119,998,230-119,998,596) is shown. CpG sites are represented by circles; white circle: methylation call will be obtained in the MassCLEAVE™ assay; crossed gray circle: methylation call will be missed, because fragments mass falls outside of spectral range of analysis; red diagonal line: approximate cleavage site; dotted line: combined methylation call due to overlapping peaks in spectrum. T-cleavage is more informative than C-cleavage when interrogating CpG islands due to RNaseA digestion after every CpG site in the C-cleavage reaction. (C) New schematic representation of DNA methylation data. Due to the specific fragmentation of a transcript, multiple CpG sites can be present within one fragment. Also, fragments with identical masses will show overlapping peaks in the MALDI-TOF-MS spectrum, resulting in a combined DNA methylation call. This new graphical representation of the DNA methylation incorporates all this information. The white circles represent the CpG sites that are analyzed in the MassCLEAVE™ assay. The crossed grey circles represent CpG sites that will be missed in the assay, and the red diagonal lines are the RNase A cleavage sites. The colored circles in the average view indicate the methylation calls given by the assay with the dashed lines linking these calls back to the CpG site(s) within the interrogated sequence. In the detailed view, the relative abundance of unmethylated, partially methylated, and fully methylated molecules is visualized as proportional bars for each fragment (white, gray and black bars, respectively). This view allows an in-depth graphical comparison of samples at the highest resolution possible.
Figure 1.
Figure 1.
MALDI-TOF-MS DNA methylation analysis. Overview of the MassCLEAVE™ assay. (A) Genomic DNA is bisulphite treated and PCR-tagged to include the T7 promoter sequence. As shown, either top or bottom strand can be used for amplification. Subsequent alkaline phosphatase (SAP) treatment, in vitro transcription using T7 R&DNA polymerase and a specific nucleotide mixture plus RNase A cleavage results in specific fragmentation. As exemplified, the top and bottom strands can have markedly different fragmentation patterns. The obtained mixture of fragments can be analyzed by MALDI-TOF-MS. Spectrum peaks representing methylated and unmethylated fragments are used to calculate methylation levels for every fragment. (B) In silico transcript fragmentation. The use of T- or C-cleavage mixtures on either the top or bottom strand of bisulphite-treated DNA can yield quite different fragmentation patterns. Here, the fragmentation of the CpG island of INHBB (chr2:119,998,230-119,998,596) is shown. CpG sites are represented by circles; white circle: methylation call will be obtained in the MassCLEAVE™ assay; crossed gray circle: methylation call will be missed, because fragments mass falls outside of spectral range of analysis; red diagonal line: approximate cleavage site; dotted line: combined methylation call due to overlapping peaks in spectrum. T-cleavage is more informative than C-cleavage when interrogating CpG islands due to RNaseA digestion after every CpG site in the C-cleavage reaction. (C) New schematic representation of DNA methylation data. Due to the specific fragmentation of a transcript, multiple CpG sites can be present within one fragment. Also, fragments with identical masses will show overlapping peaks in the MALDI-TOF-MS spectrum, resulting in a combined DNA methylation call. This new graphical representation of the DNA methylation incorporates all this information. The white circles represent the CpG sites that are analyzed in the MassCLEAVE™ assay. The crossed grey circles represent CpG sites that will be missed in the assay, and the red diagonal lines are the RNase A cleavage sites. The colored circles in the average view indicate the methylation calls given by the assay with the dashed lines linking these calls back to the CpG site(s) within the interrogated sequence. In the detailed view, the relative abundance of unmethylated, partially methylated, and fully methylated molecules is visualized as proportional bars for each fragment (white, gray and black bars, respectively). This view allows an in-depth graphical comparison of samples at the highest resolution possible.
Figure 2.
Figure 2.
Accuracy and precision of MassCLEAVE™ DNA methylation detection in EN1 CpG island. The reproducibility and quantitation of different CpG methylation levels were assessed using MassCLEAVE™ technology (A) We measured the DNA methylation calls according to the MassCLEAVE™ technology, but using ASF (Supplementary Data). Known input ratios of completely methylated and unmethylated DNA fragments (referred to as 0, 5, 10, 25, 50, 75, 90 or 100% methylated input DNA; panels from upper left to lower right, respectively) were either analyzed immediately in a T7 transcription-RNase A digestion reaction, followed by a MALDI-TOF MS analysis (direct analysis, gray bars), or analyzed following an extra PCR step (PCR + analysis, black bars). For each panel, the methylation calls are arranged per fragment in an increasing mass order (x-axis) and the measured methylation ratios (y-axis) are given as means + SEM of five replicate measurements. The dotted vertical line indicates the 1700 Da threshold, and the horizontal dotted lines represent the input methylation levels. (B) Accuracy of DNA methylation calls by MassCLEAVE™ and PCR-induced bias. The left panel shows the mean DNA methylation calls of fragments with a mass over 1700 Da (y-axis) plotted against the input levels (x-axis), revealing a high correlation between input and output levels. The right panel shows the difference between the assay output and the known input (error) versus the input DNA methylation levels, revealing a small but consistent bias. The data for the direct analysis is plotted as a grey line and the data for PCR + analysis is shown as a dashed black line. Data are given as means + SEM of five replicate measurements. Similar accuracy and precision data for SCTR and INHBB CpG islands are given as Supplementary Data files.
Figure 3.
Figure 3.
Template dilution test for transcription and subsequent MALDI-TOF analysis. The minimal amount of PCR template required for accurate quantitation of DNA methylation was determined. (A) A twofold dilution series was prepared from T7-tagged PCR amplifications of EN1 CpG island (50/50% mixture of fully unmethylated and fully methylated PCR product), ranging from 80 to 2.5 nM, and 5 μl of each dilution was visualized on an agarose gel. Adjacent marker lanes contain 500 ng pBR322 digested with HinFI. (B) Two microliters of the dilution series was used in the transcription-RNase A digestion reaction and subjected to MALDI-TOF MS analysis, in five technical replicates. The ratio of detected versus expected fragments with CpG sites was determined in all spectra and are presented as individual bars for each analysis. (C) The average methylation calls ratios calculated from the detected peaks in the spectra are shown as means + SEM. The dotted horizontal line represents the actual methylation level used as input. Similar template dilution studies for SCTR and INHBB CpG island regions are given as Supplementary Data files.
Figure 4.
Figure 4.
Variability in DNA methylation quantitation. Methylation variability due to bisulphite conversion or PCR amplification was evaluated. (A) In three independent experiments, a mixture of 25% enzymatically methylated gDNA and 75% blood gDNA (generally unmethylated) was bisulphite treated in triplicate and EN1 CpG island PCR-amplified in triplicate. The mean + SEM results are graphed per bisulphite conversion (BSC) and per fragment. The numbers below the graph indicate which CpG sites are interrogated together in the respective fragment and the numbering of the sites is according to the position in amplicon. The point (.) between numbers indicates adjacent CpG sites present within one fragments, whereas the equals to sign (=) is indicative of CpG sites that are part of different fragments, but analyzed together because of identical fragment masses. The variability in the methylation calls shown in this graph is caused by PCR amplification of bisulphite-treated single-stranded DNA. (B) To be able to interrogate the variability introduced by the bisulphite conversion, we calculated the average methylation calls of the triplicate PCR reactions on the same bisulphite-treated gDNA, and used these values to graph the DNA methylation calls per fragment obtained from three independent bisulphite conversions. Similar variability studies for SCTR and INHBB CpG island regions are given as Supplementary Data files.
Figure 5.
Figure 5.
SYBR Green melt curve analysis to determine PCR success. SYBR Green PCR melt curve analysis and its compatibility with the MassCLEAVE™ assay was assessed. (A) The use of SYBR Green in the PCR reaction enables a rapid screening for a successful amplification. Here, typical results of a completely methylated (red line), a completely unmethylated (green lines) and a no template control (blue line) PCR of EN1 CpG island are shown. Rapid screening using SYBR Green PCR melt curve analysis also yields information on the global methylation state of the region interrogated (i.e. a temperature shift in the position of the peak in the melt curve, indicated by the two-headed arrow). (B) A comparison of a MassCLEAVE™ analysis with or without SYBR Green for EN1 CpG island (solid blue line or dashed black line, respectively) revealed similar results, indicating that SYBR Green does not influence the methylation calling in the assay. Similar studies for SCTR and INHBB CpG island regions are given as Supplementary Data files.
Figure 6.
Figure 6.
Comparison of DNA methylation quantitation by MassCLEAVE™ and clonal bisulphite sequencing. Three samples of colorectal tumor and matched normal tissue were analyzed for the DNA methylation status of the CpG islands of EN1, SCTR or INHBB. In each graph panel, the colored line (either red for tumor or green for matched normal) represents the results obtained from the MassCLEAVE™ assay (triplicate assays). The dashed black line is derived from the clonal bisulphite sequencing results shown under each graph; the binary data (either methylated or unmethylated) of 10–11 clones was combined according to the fragmentation pattern in the MassCLEAVE™ assay. The CpG sites corresponding to fragments are indicated by the connecting lines under the graphs (gray lines for adjacent sites and pink lines for non-adjacent sites). The DNA methylation levels appear similar in both assays, indicating the robustness of both techniques. Asterisks indicate MassCLEAVE fragments with a mass below 1700 Da. White and black circles represent unmethylated and methylated CpG sites, respectively, and ‘A’ (red) depicts a polymorphism for rs2244213. The MassCLEAVE data for INHBB in patient 9-tumor have not been determined.
Figure 7.
Figure 7.
Analysis of allele-specific methylation levels. Allele-specific methylation levels of GNAS and H19/IGF2 imprinted regions using MassCLEAVE™ assay was determined. (A) Hypothetical MALDI-TOF spectrum section for a differentially methylated imprinted region. The three CpG sites present in this fragment can give rise to four different peaks, depending on the methylation status of each individual CpG site. In an imprinted region, one allele is completely methylated and the other allele completely unmethylated, therefore only two peaks of equal signal-to-noise ratio should be present, representing both alleles. (B) Theoretical comparison of the DNA methylation analysis of an imprinted region using either clonal bisulphite sequencing or MassCLEAVE™ approach (for an explanation of schematic assay, see Figure 1c). Both assays can discriminate between imprinted and non-imprinted regions. (C) Example of SNP discovery using the MassCLEAVE™ assay. An unexpected peak distribution was obtained in the MALDI-TOF-MS analysis of the imprinted control region of the GNAS cluster on chromosome 20 (chr20:56,859,080-56,859,449). Analysis of the composition of the novel peak revealed the presence of a novel SNP (deposited as ss71641550 [A/T]). The fragmentation of this region associated the polymorphism with the methylation status of the neighboring CpG site, allowing an allele-specific methylation call for this site (the black or white circles represent methylated or unmethylated CpG sites, respectively). (D) Example of simultaneous SNP genotyping and analysis of the allele-specific methylation status. Four different genomic samples were analyzed for the imprinting status of the imprinted control region of the H19/IGF2 cluster (chr11:1,977,509-1,977,914) using the MassCLEAVE™ assay and revealed the SNP status for rs10732516. Since the fragment containing this polymorphism also contains one or three CpG sites, the methylation status associated with the neighboring CpG sites could be deduced simultaneously. Note that the peaks for the A allele of rs10732516 overlap with the peaks of another fragment (CpG7) resulting in increased peak heights.

References

    1. Gardiner-Garden M, Frommer M. Transcripts and CpG islands associated with the pro-opiomelanocortin gene and other neurally expressed genes. J. Mol. Endocrinol. 1994;12:365–382. - PubMed
    1. Baylin SB, Ohm JE. Epigenetic gene silencing in cancer - a mechanism for early oncogenic pathway addiction? Nat. Rev. 2006;6:107–116. - PubMed
    1. Feinberg AP, Tycko B. The history of cancer epigenetics. Nat. Rev. 2004;4:143–153. - PubMed
    1. Jones PA, Baylin SB. The fundamental role of epigenetic events in cancer. Nat. Rev. 2002;3:415–428. - PubMed
    1. Morgan HD, Santos F, Green K, Dean W, Reik W. Epigenetic reprogramming in mammals. Hum. Mol. Genet. 2005;14:R47–R58. - PubMed

Publication types