Comparative Study
. 2007 Sep 12;27(37):9928-40.
doi: 10.1523/JNEUROSCI.2185-07.2007.

A single injection of an adeno-associated virus vector into nuclei with divergent connections results in widespread vector distribution in the brain and global correction of a neurogenetic disease

Affiliations
Comparative Study

A single injection of an adeno-associated virus vector into nuclei with divergent connections results in widespread vector distribution in the brain and global correction of a neurogenetic disease

Cassia N Cearley et al. J Neurosci. .

Abstract

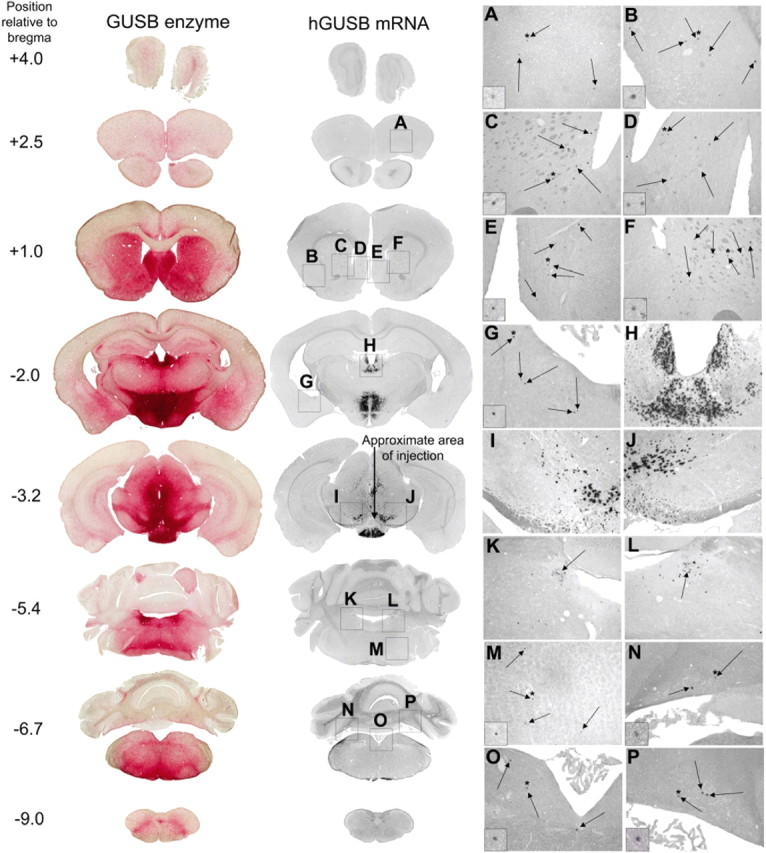
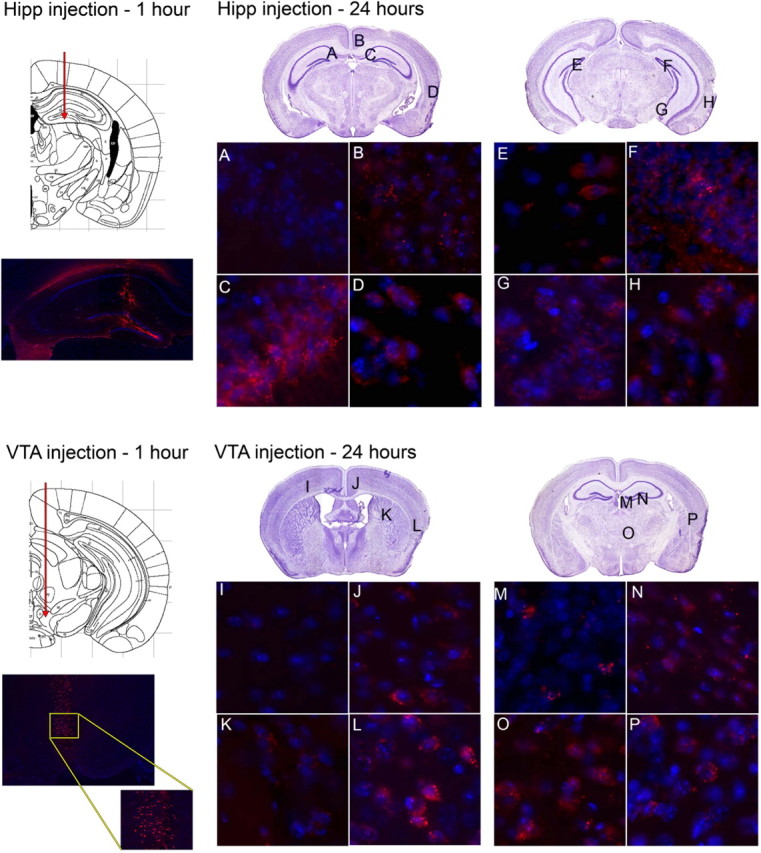
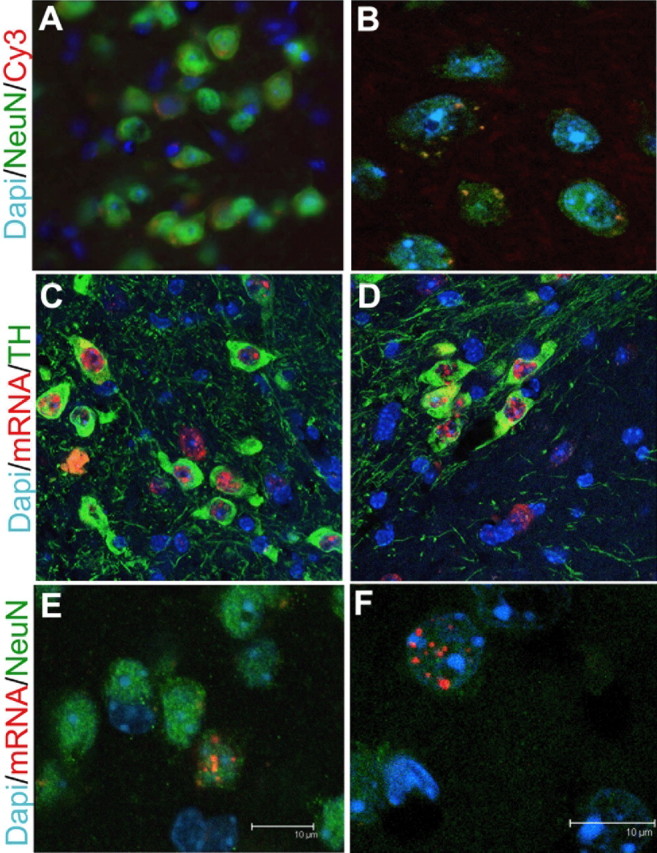
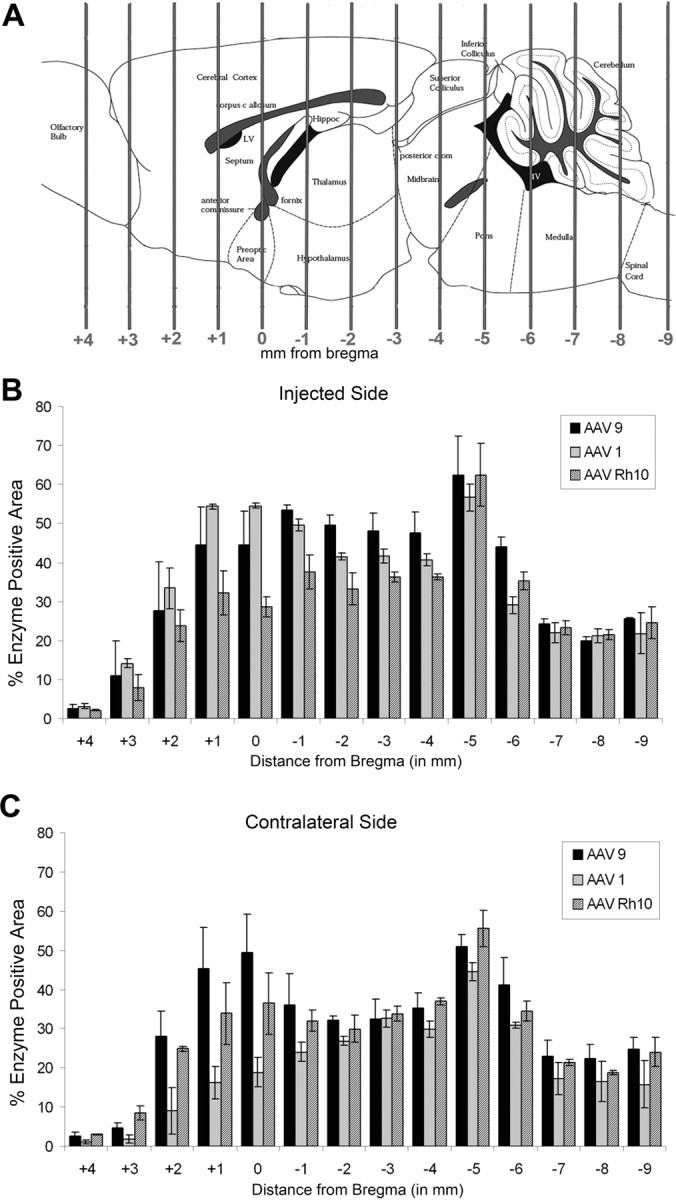
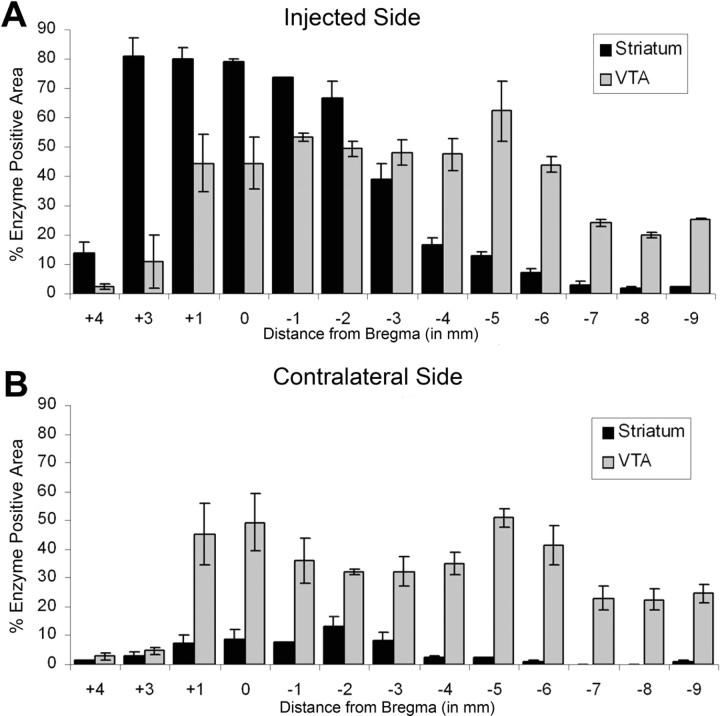
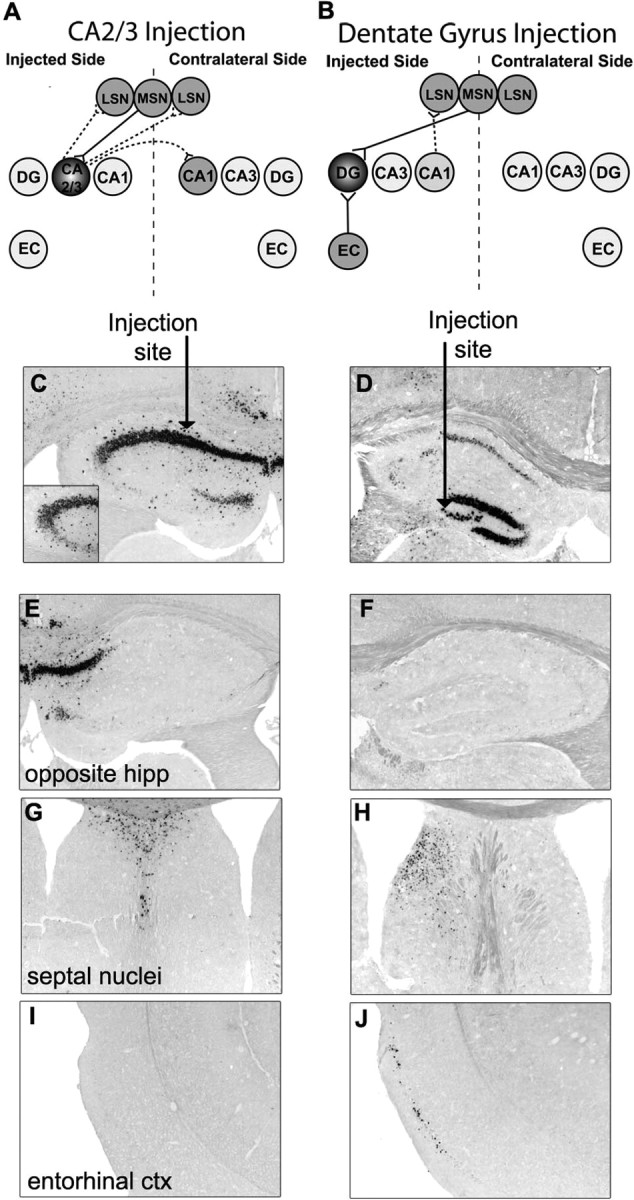
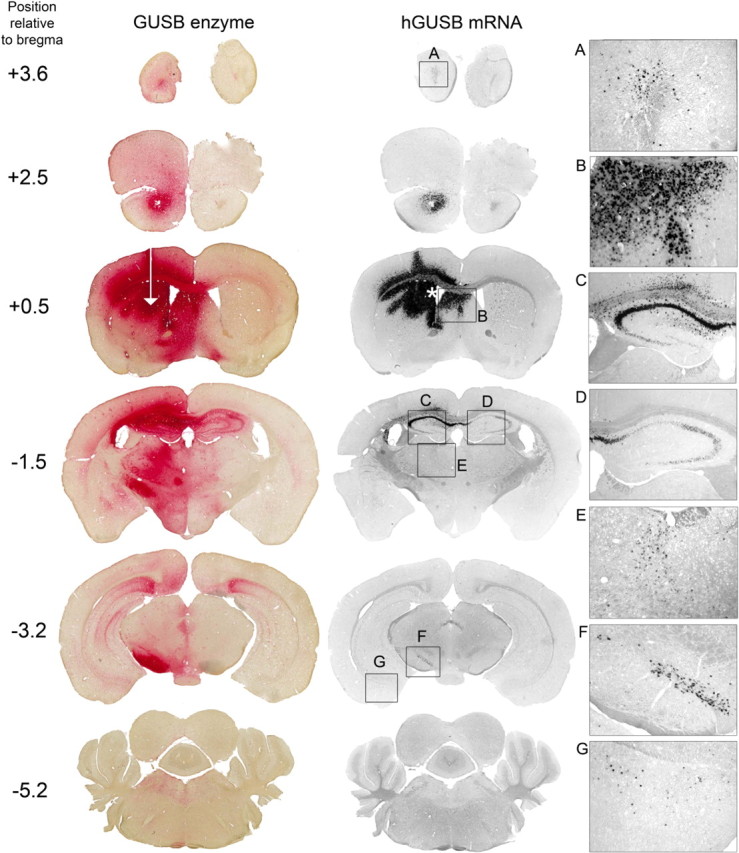
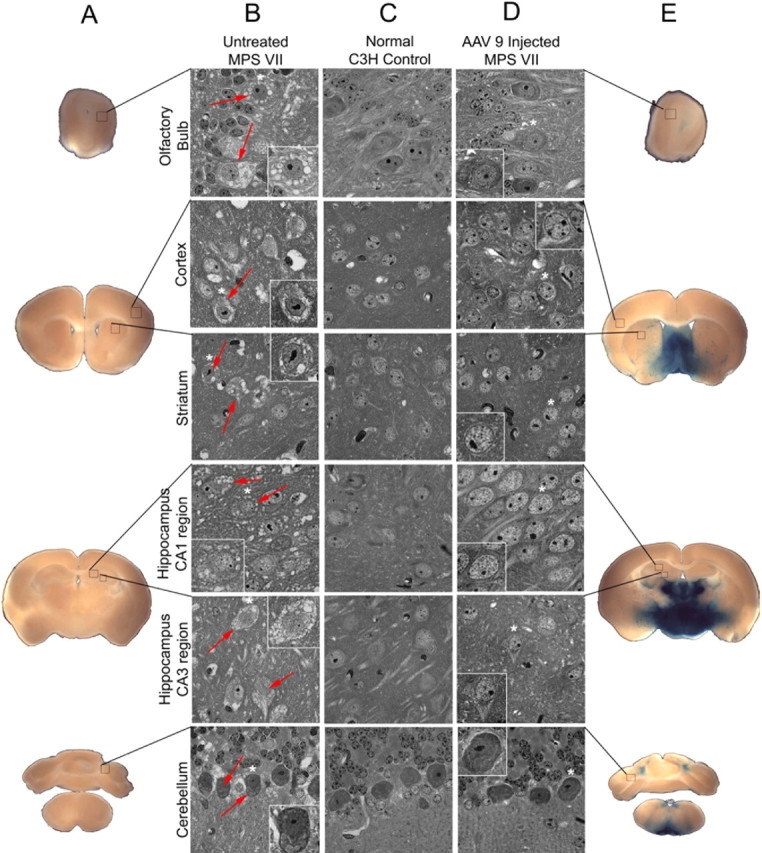
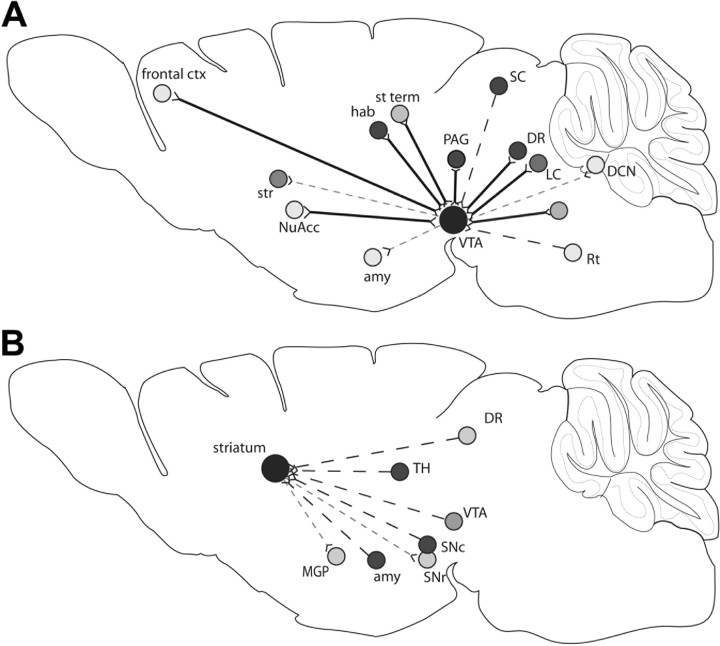
Neurogenetic disorders typically affect cells throughout the brain. Adeno-associated virus (AAV) vector-mediated transfer of a normal cDNA can correct the metabolic defects at the site of injection, but treatment of the entire brain requires widespread delivery of the normal gene and/or protein. Current methods require multiple injections for widespread distribution. However, some AAV vectors can be transported along neuronal pathways associated with the injected region. Thus, targeting widely dispersed systems in the CNS might be a pathway for gene dispersal from a limited number of sites. We tested this hypothesis in the ventral tegmental area (VTA), a region with numerous efferent and afferent projections. A single 1 mul injection resulted in transport of the vector genome to projection sites in distal parts of the brain. When compared with injections into the striatum, the VTA injection resulted in higher enzyme levels in more regions of the brain. The AAV-9 serotype vector was the most widely disseminated, but AAV-Rh.10 and AAV-1 were also transported after VTA injection. The effect on global lesions of a neurogenetic disease was tested in the mouse model of MPS VII (mucopolysaccharidosis VII), a lysosomal storage disorder. Widespread distribution of the vector genome after AAV-9 VTA injection resulted in even further distribution of the enzyme product, by secretion and uptake by surrounding cells, and complete correction of the storage lesions throughout the entire brain. This unprecedented level of correction from a single injection into the developed brain provides a potential strategy to correct a large volume of brain while minimizing the number of injections.


Figures

Figure 1.
Figure 1.
A single injection of AAV-9 into the VTA resulted in vector-positive cells in many regions of the brain known to be projection sites of the VTA and enzyme-positive cells throughout the brain. Normal animals (n = 4) were given injections of 1 μl of AAV-9 hGUSB into the unilateral VTA and analyzed 2 months after injection. Shown are the enzyme histochemistry and corresponding in situ hybridization. The approximate position of the section relative to bregma is given on the left. The arrow in the in situ hybridization section at −3.2 mm shows the approximate injection tract, with the injection at the arrowhead. Boxes A–P (not drawn to scale) on the in situ hybridization sections correspond to the magnified images on the right from the prefrontal cortex (A), piriform cortex (B), striatum (C, F), septal nuclei (D, E), amygdala (G), habenula and mediodorsal thalamic nucleus (H), substantia nigra (I, J), locus ceruleus (K, L), reticular nuclei (M), medial vestibular/prepositus nucleus and tegmental nuclei (O), and cerebellum (N, P). All of these regions have known projections with the VTA. Arrows within A–G and M–P show in situ positive cells. Arrows in K and L show the location of the locus ceruleus. Insets in A–G and M–P are further magnified images showing representative in situ positive cells. Asterisks are shown above the cells that have been magnified.
Figure 2.
Figure 2.
Cy3-labeled AAV-9 vector distribution after injection into the hippocampus or VTA. Animals were given injections of Cy3-labeled AAV-9 virions into the hippocampus (Hipp; top) or VTA (bottom) and killed at 1 h (left) or 24 h (right) after injection. Slides were costained with DAPI. The 1 h injection time-point panels show the hippocampus or VTA injection tracts (above) [images adapted from Paxinos and Franklin (2001)] and the presence of fluorescent vector (below), demonstrating the desired location of the injection. The inset in the 1 h VTA injection panel is a higher magnification of the selected region. The 24 h panels show sites analyzed by fluorescent microscopy. Locations designated by letters on Nissl-stained sections (from Paxinos and Franklin, 2001) are shown at high magnification at the bottom half of each panel. Images are from areas that did not receive Cy3-labeled particles (A, I) or did receive Cy3-labeled particles (B–H, J–P).
Figure 3.
Figure 3.
Localization of vector after an injection of AAV-9 into the VTA. A, B, To demonstrate the location of Cy3-labeled particles at 24 h after injection, sections from animals injected with Cy-3-labeled AAV-9 vector (red) into the VTA were costained with DAPI (blue) to label nuclei and NeuN (green) to label neurons. Pictures were taken using nonconfocal (40×, 2× zoom) (A) and confocal (100×, 2× zoom) (B) microscopy and are of the cortex (A) and striatum (B). C, D, Fluorescent in situ hybridization (FISH) using a DIG-labeled riboprobe against the hGUSB mRNA sequence was used to label hGUSB mRNA-positive cells (red) on sections from animals given injections of AAV-9 into the VTA and killed 1 month after injection. Sections were then costained with an anti-TH antibody, and slides were coverslipped using a mounting medium with DAPI. Pictures were taken using 100× confocal magnification and are of the VTA (C) or substantia nigra (D). E, F, To determine whether the hGUSB mRNA was located within the nucleus of striatal neurons, anterograde targets of the VTA, FISH was performed on sections that were then costained with anti-NeuN and coverslipped with DAPI. E is a compressed z-stack, and F represents a single plane of another cell to demonstrate nuclear localization. Scale bars: E, F, 10 μm.
Figure 4.
Figure 4.
GUSB enzyme expression resulting from a single injection of AAV-9, AAV-1, or AAV-Rh.10 hGUSB into the VTA. Animals were given injections of 1 μl of AAV-9, AAV-1, or AAV-Rh.10 hGUSB into the unilateral VTA and analyzed 2 months after injection. A, The location of the VTA is represented on the brain illustration (adapted from Paxinos and Franklin, 2001). B, C, Tissue sections that underwent enzyme histochemistry were scanned into the computer and analyzed using a custom-designed Image-Pro program, which calculated the percentage of red area in each section. Three 20 μm sections at 100 μm apart for every 1 mm region were analyzed for each animal (n = 3 per group), the values were averaged, and the SEMs were calculated to give the values shown on the chart. The x-axis shows the distance from bregma. Hippoc, Hippocampus; LV, lateral ventricle; Pons, pontine nuclei. The injected side (B) was analyzed separately from the noninjected side (C). Enzyme expression from AAV-9-injected animals is shown by black bars, from AAV-1-injected animals is shown by light gray bars, and from AAV-Rh.10-injected animals is shown by striped bars.
Figure 5.
Figure 5.
GUSB enzyme expression resulting from a single injection of AAV-9 into the striatum or VTA. The analysis was the same as that for Figure 4. Animals were given injections of AAV-9 into the unilateral striatum (Str) or VTA and analyzed at 1 month after injection (n = 3 per group). The injected side (A) was analyzed separately than the contralateral side (B). The enzyme expression levels after VTA injection are represented by light gray bars, whereas the enzyme expression levels after striatum injection are represented by black bars. The distances from bregma can be mapped to the illustration in Figure 4A. Because of the mounting process, sections around 2 mm rostral to bregma from striatum-injected brains were lost, so are not shown on the graph. Error bars indicate SEMs.
Figure 6.
Figure 6.
An injection of AAV-9 into the hippocampus results in vector transport along known projections. Animals were given injections of 1 μl of AAV-9 GUSB into the unilateral hippocampus and analyzed 2 months after injection. C, D, Injections into the hippocampus were variable with some animals receiving injections into the CA2/3 region (C) and some animals receiving injections into the dentate gyrus (DG) region (D). The arrow represents the site of injection. The inset in C shows transduction of the CA3 region. A, B, E–J, Connections of the CA2/3 region (A) and DG region (B) are known and correspond with areas where hGUSB mRNA expression was or was not found, including the opposite hippocampus (hipp) (E, F), medial (MSN) and lateral (LSN) septal nuclei (G, H), and entorhinal cortex (EC; ctx) (I, J). Within the hippocampus connection diagrams (A, B), solid lines represent retrograde targets and dotted lines represent anterograde targets of the injected region. The regions injected are darkly shaded, whereas the distal sites that were found to have hGUSB mRNA are shaded lighter.
Figure 7.
Figure 7.
An injection of AAV-9 into the striatum results in vector transport along known projections. Animals (n = 3) were injected into the unilateral striatum and analyzed 1 month after injection. The injection site is represented by the white arrow. Resultant enzyme and vector genome (hGUSB mRNA) are shown. Boxes A–G (not drawn to scale) on the in situ hybridization sections correspond to panels A–G on the right. An injection into the striatum also resulted in transduction of the SVZ (asterisk) and septal nuclei (B) by diffusion. Vector genome was transported to the olfactory bulb (A), ipsilateral hippocampus (C), contralateral hippocampus (D), thalamus (E), substantia nigra pars compacta (F), and amygdala (G). Images in panels A–G were taken using 10× magnification.
Figure 8.
Figure 8.
Enzyme expression and correction of lysosomal storage 2 months after AAV-9 hGUSB injection into the VTA of MPS VII animals. A, E, Brains from AAV-9 hGUSB-injected MPS VII mice (n = 3), noninjected MPS VII mice (n = 3), and normal mice (n = 3) were divided into 500-μm-thick slabs and stained for enzyme expression using an X-Gluc reaction to demonstrate enzyme expression in the AAV-treated brain (E) compared with the untreated MPS VII brain (A). B–D, Slabs were then embedded in JB4 resin, sectioned into 1-μm-thick sections, and stained with toluidine blue to visualize storage vacuoles. Boxes (not drawn to scale) on the X-Gluc-stained sections (A, E) show the area that the magnified images (B–D) represent. There were numerous storage vacuoles present in many regions of the untreated MPS VII brain (B). Examples of cells with storage vacuoles are shown with red arrows. Within each magnified image from untreated (B) or treated (D) MPS VII mice, higher-magnified images (outlined in white) show single cells. The cells represented by these higher-magnification images have asterisks above them in the lower-magnification images. The extensive storage found in the untreated MPS VII animals is shown in the olfactory bulb, cortex, striatum, hippocampus, and cerebellum (B). No storage was found in any of these representative regions in either the normal control brains (C) or in the AAV-9-injected MPS VII brains (D).
Figure 9.
Figure 9.
Projection sites of the VTA or striatum and the presence or absence of vector genome within the regions after injection of AAV-9. Diagrams illustrate the retrograde (dashed black line) anterograde (dashed gray line), and reciprocal (solid black line) projection sites of the VTA (A) or striatum (B). Projection sites are represented by shaded circles, and the shade represents the relative level of vector genome-positive cells in that region, with the darker the circle the more cells found to have vector genome. ctx, Cortex; str, striatum; NuAcc, nucleus accumbens; amy, amygdale; Rt, reticular nuclei; DCN, deep cerebellar nuclei; LC, locus ceruleus; DR, dorsal raphe; SC, superior colliculus; PAG, periaqueductal gray; st term, bed nucleus of the stria terminalis; hab, habenula; LGP, lateral globus pallidus; MGP, medial globus pallidus; Snr, substantia nigra pars reticulate; Snc, substantia nigra pars compacta; TH, thalamus.

References

    1. Altman J. Autoradiographic and histological studies of postnatal neurogenesis. IV. Cell proliferation and migration in the anterior forebrain, with special reference to persisting neurogenesis in the olfactory bulb. J Comp Neurol. 1969;137:433–457. - PubMed
    1. Bartlett JS, Samulski RJ. Fluorescent viral vectors: a new technique for the pharmacological analysis of gene therapy. Nat Med. 1998;4:635–637. - PubMed
    1. Bartlett JS, Samulski RJ, McCown TJ. Selective and rapid uptake of adeno-associated virus type 2 in brain. Hum Gene Ther. 1998;9:1181–1186. - PubMed
    1. Bartlett JS, Wilcher R, Samulski RJ. Infectious entry pathway of adeno-associated virus and adeno-associated virus vectors. J Virol. 2000;74:2777–2785. - PMC - PubMed
    1. Beckstead RM, Domesick VB, Nauta WJ. Efferent connections of the substantia nigra and ventral tegmental area in the rat. Brain Res. 1979;175:191–217. - PubMed

Publication types

MeSH terms

LinkOut - more resources