Comparative Study
. 2007 Sep 12;27(37):10015-23.
doi: 10.1523/JNEUROSCI.1158-07.2007.

Predicting odor pleasantness from odorant structure: pleasantness as a reflection of the physical world

Affiliations
Comparative Study

Predicting odor pleasantness from odorant structure: pleasantness as a reflection of the physical world

Rehan M Khan et al. J Neurosci. .

Abstract

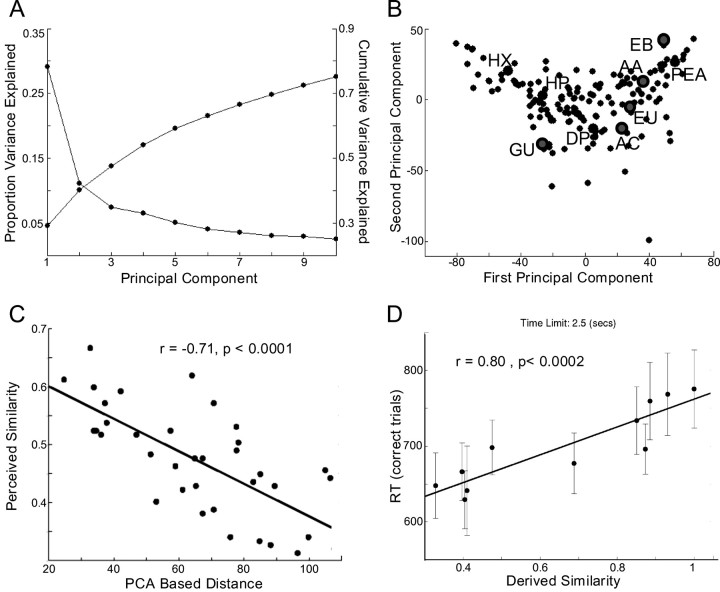
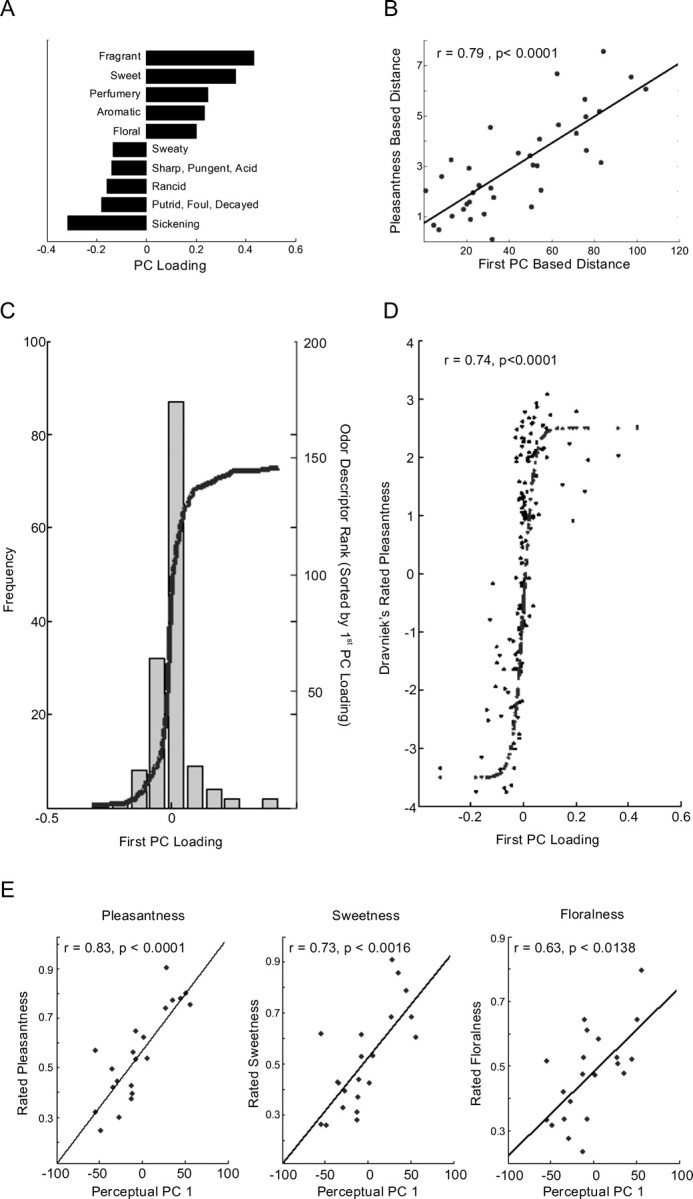
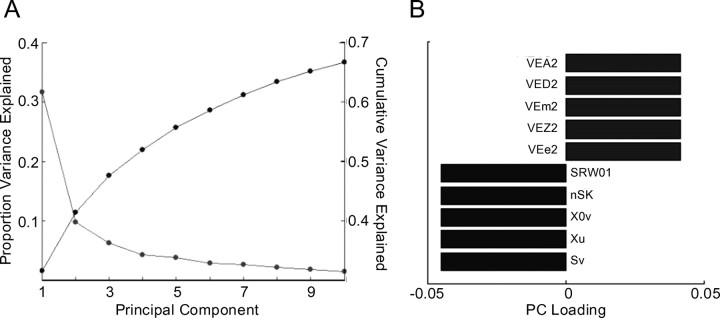
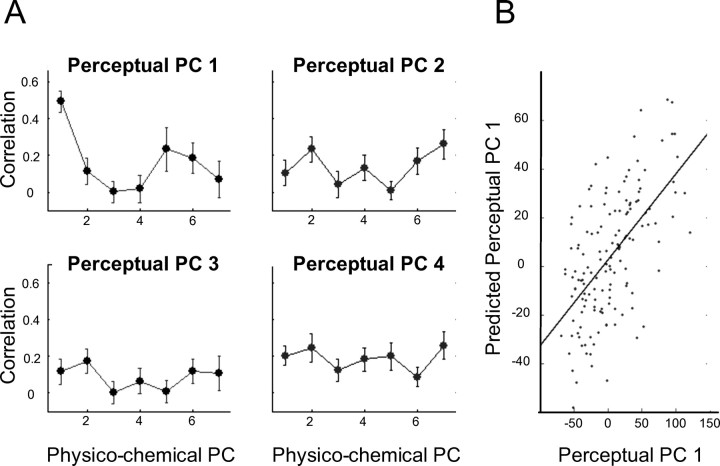
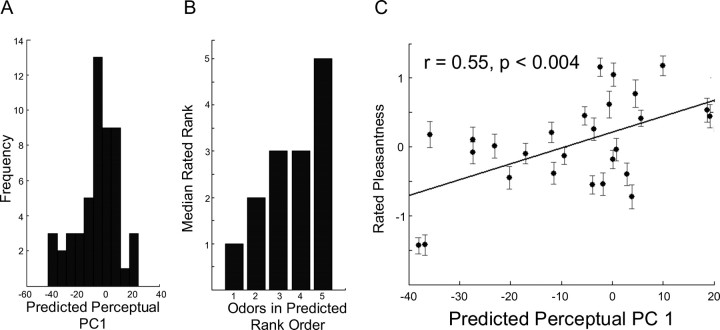
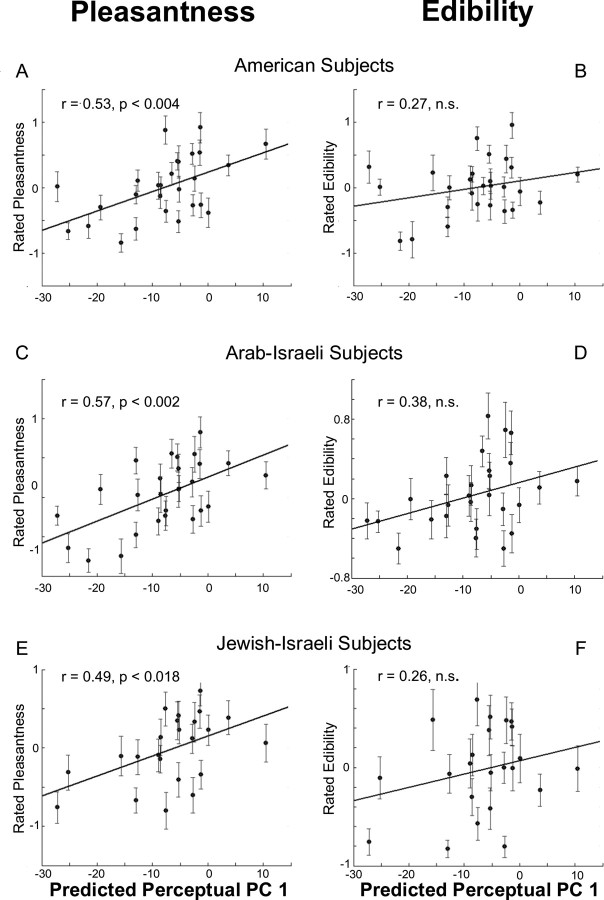
Although it is agreed that physicochemical features of molecules determine their perceived odor, the rules governing this relationship remain unknown. A significant obstacle to such understanding is the high dimensionality of features describing both percepts and molecules. We applied a statistical method to reduce dimensionality in both odor percepts and physicochemical descriptors for a large set of molecules. We found that the primary axis of perception was odor pleasantness, and critically, that the primary axis of physicochemical properties reflected the primary axis of olfactory perception. This allowed us to predict the pleasantness of novel molecules by their physicochemical properties alone. Olfactory perception is strongly shaped by experience and learning. However, our findings suggest that olfactory pleasantness is also partially innate, corresponding to a natural axis of maximal discriminability among biologically relevant molecules.


Figures

Figure 1.
Figure 1.
Olfactory perceptual space. A, The proportion of variance in perceptual descriptions is explained by each of the PCs (starting at ∼0.3), and the cumulative variance is explained (starting at ∼0.05). B, The 144 odorants projected into a two-dimensional space made of the first and second PCs. The nine odorants used in experiment 1[acetophenone (AC), amyl acetate (AA), diphenyl oxide (DP), ethyl butyrate (EB), eugenol (EU), guaiacol (GU), heptanal (HP), hexanoic acid (HX), and phenyl ethanol (PEA)] are in enlarged circles, and the five odorants used in experiment 2 (acetophenone, amyl acetate, ethyl butyrate, eugenol, guaiacol) are in further enlarged circles. C, For the nine odorants, the correlation between explicit perceived similarity ratings and PCA-based distance for all pairwise comparisons. Odorants closer in the perceptual space were perceived as more similar. D, Reaction time for correct trials in a forced-choice same-different task using five of the nine odorants. Error bars reflect SE. The reaction time was longer for odorant pairs that were closer in PCA-based space, thus providing an implicit validation of the perceptual space.
Figure 2.
Figure 2.
Identifying pleasantness as the first PC of perception. A, The five descriptors that flanked each end of PC1 of perception. We should stress that here, and in Figure 3B, we show the five extreme descriptors only to help give a sense of the PC. This does not reflect a cutoff in any stage of the analysis, but only an esthetic cutoff for the figure. B, For the nine odorants, the correlation between the pairwise difference in pleasantness and the pairwise distance along the first PC. Distance along the first PC was a strong predictor of difference in pleasantness. C, The 146 perceptual descriptors plotted as a function of their weighting on the first PC of perception. D, The previously published pleasantness associated with each one of the 146 perceptual descriptors. The descriptors clearly weighted on the first PC of perception in accordance with their pleasantness. E, We randomly selected 21 odorants tested previously by Dravnieks (1982, (acetyl pyridine, benzaldehyde, amyl acetate, camphor dl, celeriax, citral, dimethyl pyrrole2,5, eugenol, heptanal, hexanoic acid, hexanol1, hexanol3, indole, methyl-iso-borneol2, methyl quinolinepara, octanol1, octenol-1–3-OL, phenyl ethanol, skatole, vanillin) and had 22 subjects rate all odorants using three scales with VAS extremes of “not at all flowery” versus “extremely flowery,” “not at all sweet” versus “extremely sweet,” and “extremely unpleasant” versus “extremely pleasant.” The order of VAS scales was counterbalanced. Judgments were converted to z-scores for each subject, and scores for odorants averaged across subjects. We then regressed these normalized ratings against the PC1 values for these odorants.
Figure 3.
Figure 3.
Reducing dimensionality of physicochemical space. A, The proportion of variance in physicochemical descriptors is explained by each of the PCs (starting at ∼0.32), and the cumulative variance is explained (starting at ∼0.01). B, The five descriptors that weighted most heavily at the ends of PC1 of physicochemical space. The descriptors are as follows: sV, sum of atomic van der Waals volumes (scaled on carbon atom); Xu, Xu index; Xov, pleasantness connectivity index χ-0′; nSK, number of non-H atoms; SRW01, self-returning walk count of order 01 (number of non-H atoms, nSK); VEe2, average eigenvector coefficient sum from electronegativity weighted distance matrix; VEZ2, average eigenvector coefficient sum from z-weighted distance matrix (Barysz matrix); Vem2, average eigenvector coefficient sum from mass weighted distance matrix; VEA2, average eigenvector coefficient sum from adjacency matrix; VED2, average eigenvector coefficient sum from distance matrix.
Figure 4.
Figure 4.
Relating physicochemical space to perceptual space. A, The correlation between the first to fourth (descending in the figure) perceptual PC and each of the first seven physicochemical PCs for the 144 odorants. Error bars reflect the SE from 1000 bootstrap replicates. The best correlation was between the first PC of perception and the first PC of physicochemical space. This correlation was significantly larger than all other correlations. B, For the 144 odorants, the correlation between their actual first perceptual PC value and the value our model predicted from their physicochemical data.
Figure 5.
Figure 5.
Predicting perception of novel odorants. A, The distribution of predicted first PC values for 52 novel odorants. B, The median pleasantness ranking for each of five odorants that spanned the first predicted PC, sorted by expected ranking from our model. C, The correlation between the rated pleasantness of 27 of the 52 odorants and the first PC value as predicted by our model.
Figure 6.
Figure 6.
A–C, Cross-cultural validation. Twenty-seven odorous molecules not commonly used in olfactory studies, and not previously tested by us were presented to three cultural groups of naive subjects: Americans (23 subjects), Arab-Israelis (22 subjects), and Jewish-Israelis (20 subjects). In all cases, our predictions of odorant pleasantness were in fact better than in the test data (Fig. 4B). D–F, Ratings of edibility for the same odorants and groups. Across all cultures, our predicted PC1 values were significantly better correlated with judgments of pleasantness than judgments of edibility.

References

    1. Abraham NM, Spors H, Carleton A, Margrie TW, Kuner T, Schaefer AT. Maintaining accuracy at the expense of speed: stimulus similarity defines odor discrimination time in mice. Neuron. 2004;44:865–876. - PubMed
    1. Amoore JE. Stereochemical theory of olfaction. Nature. 1963;198:271–272. - PubMed
    1. Anderson AK, Christoff K, Stappen I, Panitz D, Ghahremani DG, Glover G, Gabrieli JD, Sobel N. Dissociated neural representations of intensity and valence in human olfaction. Nat Neurosci. 2003;6:196–202. - PubMed
    1. Ayabe-Kanamura S, Schicker I, Laska M, Hudson R, Distel H, Kobayakawa T, Saito S. Differences in perception of everyday odors: a Japanese-German cross-cultural study. Chem Senses. 1998;23:31–38. - PubMed
    1. Barkai E. Dynamics of learning-induced cellular modifications in the cortex. Biol Cybern. 2005;92:360–366. - PubMed

Publication types

Substances

LinkOut - more resources