

Breast cancer molecular signatures as determined by SAGE: correlation with lymph node status
- PMID: 17855657
- PMCID: PMC4186709
- DOI: 10.1158/1541-7786.MCR-07-0055
Breast cancer molecular signatures as determined by SAGE: correlation with lymph node status
Abstract
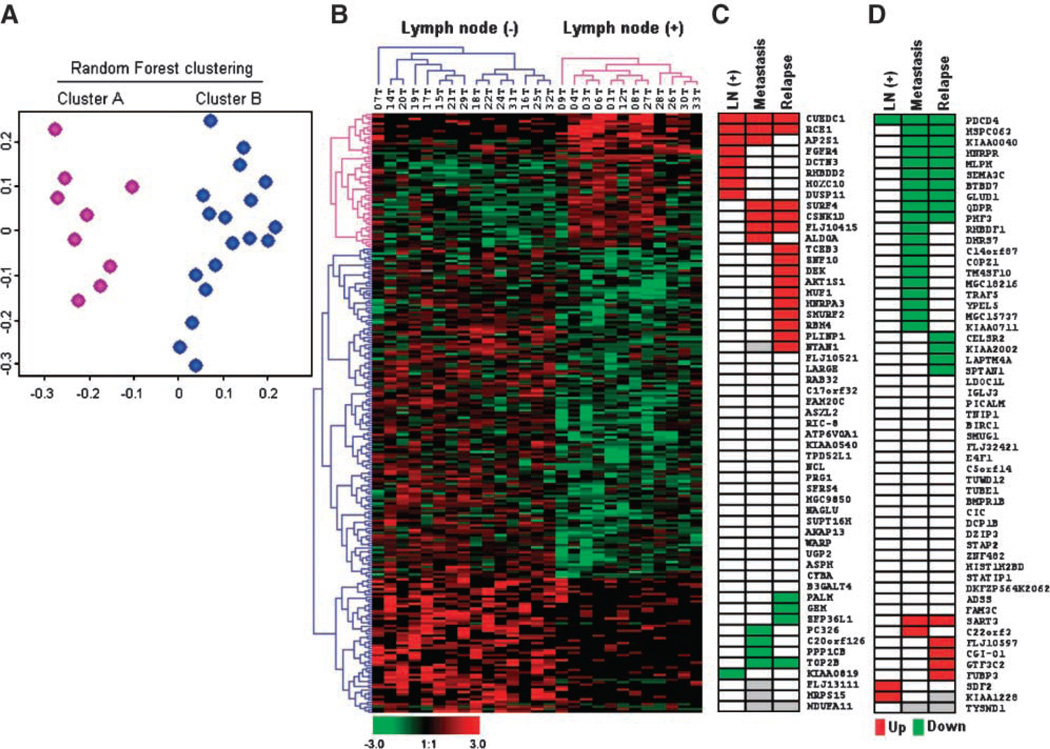
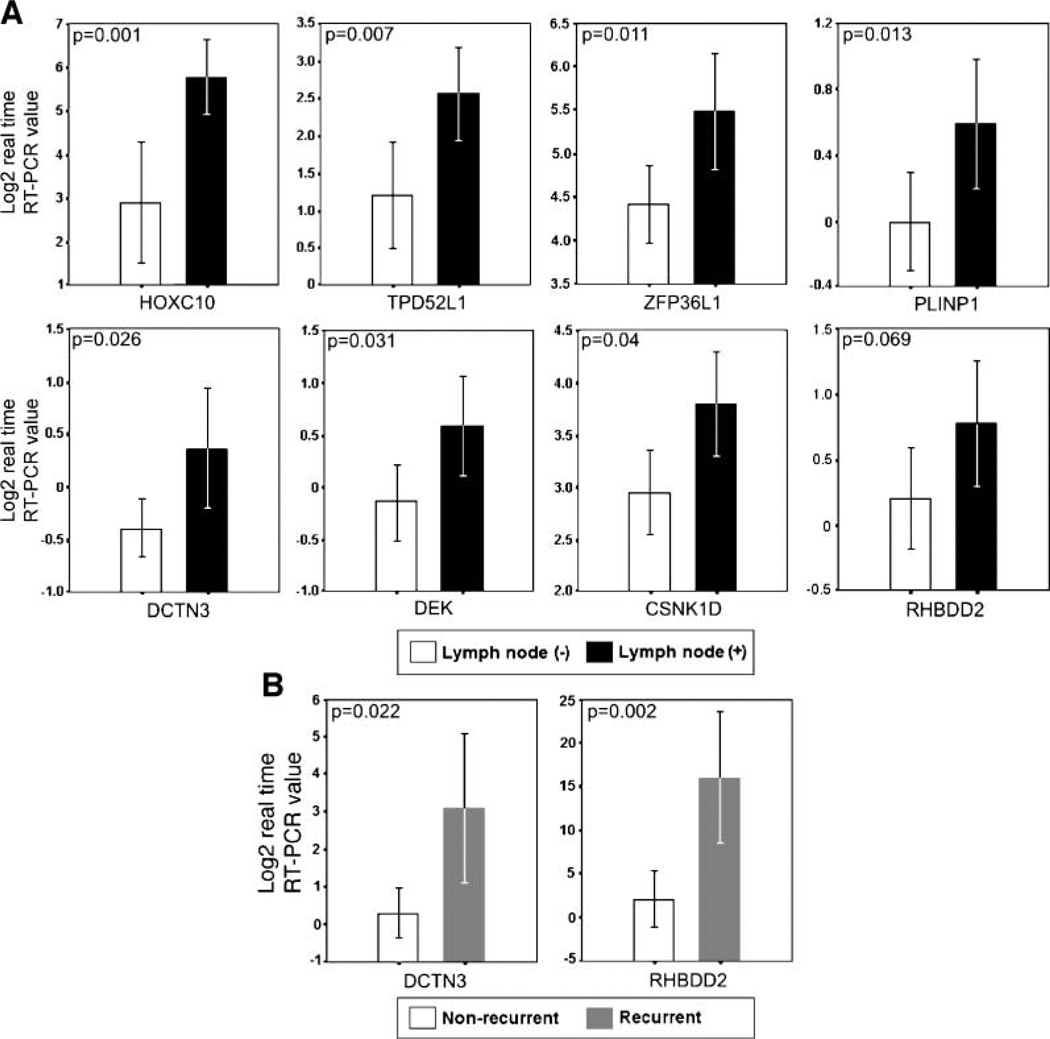
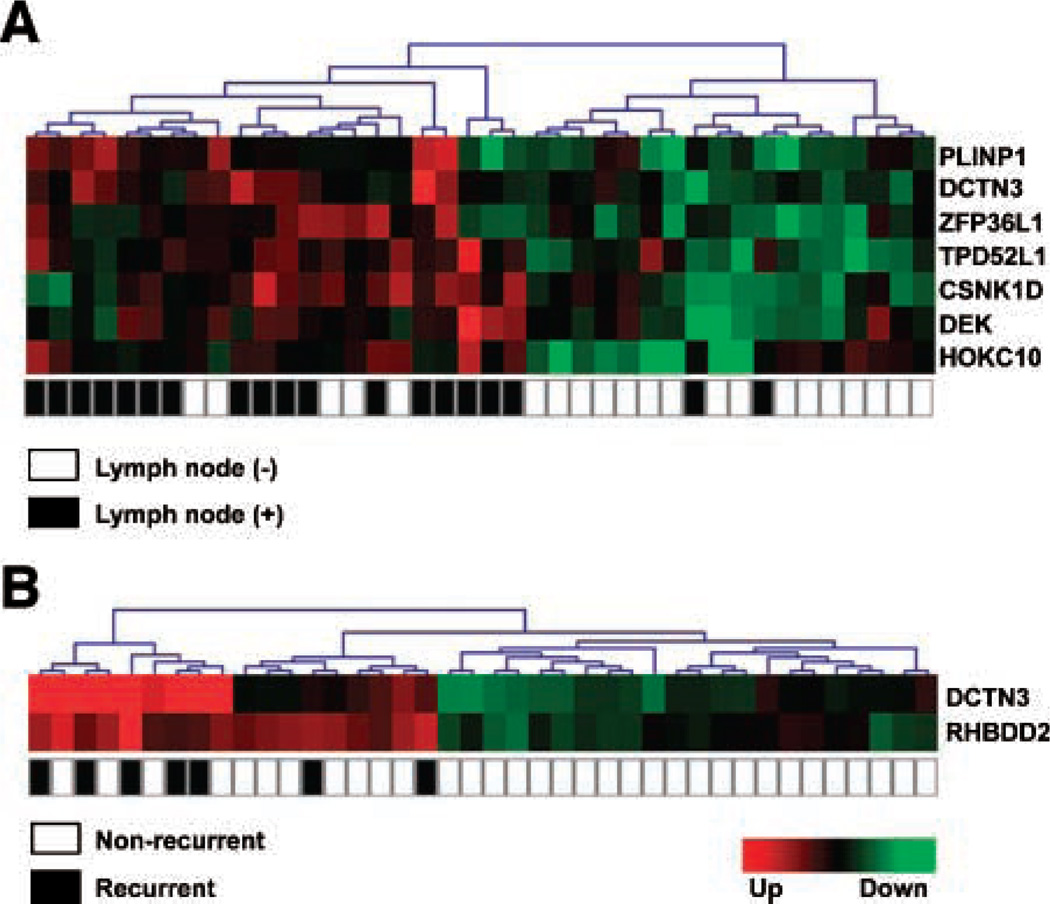
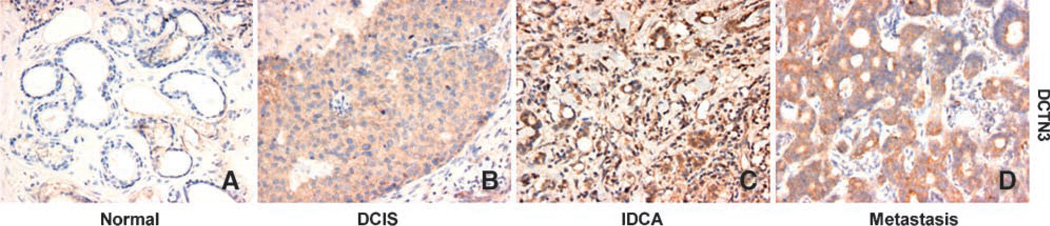
Global gene expression measured by DNA microarray platforms have been extensively used to classify breast carcinomas correlating with clinical characteristics, including outcome. We generated a breast cancer Serial Analysis of Gene Expression (SAGE) high-resolution database of approximately 2.7 million tags to perform unsupervised statistical analyses to obtain the molecular classification of breast-invasive ductal carcinomas in correlation with clinicopathologic features. Unsupervised statistical analysis by means of a random forest approach identified two main clusters of breast carcinomas, which differed in their lymph node status (P=0.01); this suggested that lymph node status leads to globally distinct expression profiles. A total of 245 (55 up-modulated and 190 down-modulated) transcripts were differentially expressed between lymph node (+) and lymph node (-) primary breast tumors (fold change, >or=2; P<0.05). Various lymph node (+) up-modulated transcripts were validated in independent sets of human breast tumors by means of real-time reverse transcription-PCR (RT-PCR). We validated significant overexpression of transcripts for HOXC10 (P=0.001), TPD52L1 (P=0.007), ZFP36L1 (P=0.011), PLINP1 (P=0.013), DCTN3 (P=0.025), DEK (P=0.031), and CSNK1D (P=0.04) in lymph node (+) breast carcinomas. Moreover, the DCTN3 (P=0.022) and RHBDD2 (P=0.002) transcripts were confirmed to be overexpressed in tumors that recurred within 6 years of follow-up by real-time RT-PCR. In addition, meta-analysis was used to compare SAGE data associated with lymph node (+) status with publicly available breast cancer DNA microarray data sets. We have generated evidence indicating that the pattern of gene expression in primary breast cancers at the time of surgical removal could discriminate those tumors with lymph node metastatic involvement using SAGE to identify specific transcripts that behave as predictors of recurrence as well.
Figures
References
-
- Van’t Veer LJ, Dai Hongyue, van de Vijver MJ, et al. Gene expression profiling predicts clinical outcome of breast cancer. Nature. 2002;415:530–536. - PubMed
-
- Van de Vijver MJ, He YD, van’t Veer LJ, et al. A gene-expression signature as a predictor of survival in breast cancer. N Engl J Med. 2002;347:1999–2009. - PubMed
-
- Ahr A, Karn T, Solbach C, et al. Identification of high risk breast-cancer patients by gene expression profiling. Lancet. 2002;359:131–132. - PubMed
Publication types
MeSH terms
Substances
Grants and funding
LinkOut - more resources
Full Text Sources
Other Literature Sources
Medical
Miscellaneous
