. 2007 Nov 15;585(Pt 1):15-28.
doi: 10.1113/jphysiol.2007.142240. Epub 2007 Sep 13.

Corticofugal modulation of the auditory thalamic reticular nucleus of the guinea pig

Affiliations

Corticofugal modulation of the auditory thalamic reticular nucleus of the guinea pig

Min Xu et al. J Physiol. .

Abstract

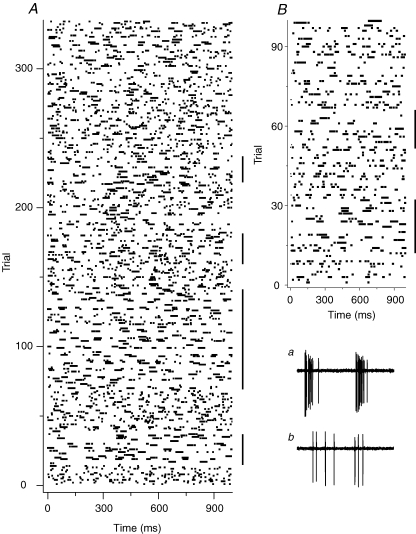
Neuronal responses to auditory stimuli and electrical stimulation were examined in 104 neurones in the auditory sector of thalamic reticular nucleus (TRN) and nine medial geniculate (MGB) neurones from anaesthetized guinea pigs. TRN neurones showed rhythmic spontaneous activities. TRN neurones changed firing pattern over time, from tonic to burst in a time interval of several seconds to tens of seconds. One-third of the TRN neurones (25/76) responded to the acoustic stimulus in a slow oscillation mode, either producing a spike burst at one time and responded with nothing another time, or producing a spike burst at one time and a single spike at the other. Thirty-two of 40 neurones received a corticofugal modulation effect. Nineteen of 32 neurones responded directly to electrical stimulation of the cortex with an oscillation of the same rhythm (7-14 Hz) as its auditory-evoked oscillation. Six neurones changed their firing pattern from burst to tonic when the auditory cortex was activated. As the TRN applied inhibition to the MGB, the oscillatory nature of inhibition would affect the fidelity of MGB relays. Thus, it was unlikely that the MGB was in relay mode when the TRN was in a slow oscillation mode. These results hint at a possible mechanism for the modulation of states of vigilance through the corticofugal pathway via the TRN.


Figures

Figure 1
Figure 1
Frontal Nissl section at the rostrocaudal coordinate RC = 9.0 mm (Rapisarda & Bacchelli, 1977) showing electrode tracks and lesion The mediolateral coordinate is shown above the map while the depth coordinate is shown on the left. The depth coordinate was established at the first penetration and kept constant during the mapping process (see for detailed method). The asterisk indicates the lesion site made after the recording in the last electrode penetration. The Nissl section was enlarged by 13.0% to match the marks of the electrode tracks with the stereotaxic coordinates of the physiological recording, since the brain sections shrank by that amount during Nissl processing. Raster displays of six auditory-responsive neurones sampled from varied locations and electrode tracks are shown. Noise-burst stimulus indicated below each raster display was used to examine the auditory response of each neurone. Duration of the stimulus was 200 ms and the interstimulus interval was 1 s. Scale bar: 250 μm.
Figure 2
Figure 2
Extracellular recordings from spontaneously firing neurones A, a rhythmic burst firing TRN neurone. A slow rhythm of ∼3 s is observed in the top trace. a, a cyclic burst shown on an expanded time scale, where a second rhythm of bursts can be detected as 3–4 Hz. b, a burst is further shown on an expanded time scale. The burst had 6 spikes with an increasing interspike interval for the later spikes. The recording was very likely from a single unit. B, simultaneous recording of the electroencephalogram at the surface of the auditory cortex and extracellular field potentials of two neighbouring TRN sites. A rhythmic, synchronized oscillation was detected from all three signals. An expanded single cycle recording of the slow rhythmic oscillation is shown in a. The spectrum of the EEG over the oscillation phase as shown in a was calculated using the FFT algorithm and is shown in b.
Figure 3
Figure 3
Raster displays showing two long-time recordings of spontaneous firings of two TRN neurones The insets in B show the recording traces sampled at two typical points: tonic response (a) and burst response (b).
Figure 4
Figure 4
Neuronal responses to an acoustic stimulus and histogram of the response latency of the recorded neurones AD, raster displays and peristimulus time histograms (PSTHs) of four neurones with various response patterns to acoustic stimuli. The acoustic stimulus is shown below each raster display. The interstimulus interval was set at 1 s. E, statistics of the response latencies of 76 neurones. Data from neurones with latency greater than 150 ms were combined.
Figure 5
Figure 5
Raster display PSTHs of auditory responses of a TRN neurone The interstimulus interval was 1 s. A, raster display and PSTH of the full-scale auditory response of the neurone. B, expanded ON responses of the same neurone.
Figure 6
Figure 6
Raster displays of TRN neurones showing a slow rhythm oscillation A, long-time recording of the responses to repeated noise-burst stimuli of 600 1 s trials. Trials of 301–400 are expanded and shown on the right. A plot of spike counts versus trial is shown on the right. B, the raster display shows neuronal responses to repeated noise-burst stimuli of 100 1 s trials. A plot of spike counts versus trial is shown on the right. C, a spectral analysis was performed using fast Fourier transform (512 data points for the neurone shown in A, upper panel, and 64 data points for the neurone shown in B, lower panel, for each of the neurons.
Figure 7
Figure 7
Simultaneous recordings of TRN and MGB neurones A and B, raster displays of two pairs of simultaneous recordings of responses of TRN and MGB neurones to the same stimulus. C, means and standard deviations of the duration of ON responses of the TRN and MGB neurones recorded in the paired recording.
Figure 8
Figure 8
Responses of TRN neurones to acoustic stimuli and electrical stimulation of the auditory cortex A and B, raster displays show neuronal responses to an acoustic stimulus (marked with ‘A’ below), to electrical stimulation (marked with ‘ES’ below), and to a combination of electrical stimulation of the auditory cortex and acoustic stimulus (marked with ‘ES + A’ below). The acoustic stimulus was a noise-burst of 200 ms and is marked under each raster display. The electrical stimulation consisted of a 5-pulse train of 100 ms duration. Electrical stimulation of the auditory cortex preceded the acoustic stimulus, with an interval of 100 ms between the stimuli. This convention applies to Fig. 9.
Figure 9
Figure 9
Corticofugal modulation of TRN neurones Raster displays show neuronal responses to an acoustic stimulus (trials 1–50, marked with ‘A’ on the right), a combination of electrical stimulation of the auditory cortex and acoustic stimulus (trials 51–100, marked with ‘ES + A’ on the right) and electrical stimulation (trials 101–150, marked with ‘ES’ on the right). Arrows indicate artifacts of electrical stimulation.
Figure 10
Figure 10
Corticofugal modulation of the rhythmic activities of TRN neurones A, extracellular recordings of two groups of TRN neurones before and during cortical ES. Two epochs before and during ES indicated with a and b are depicted in the lower panel. B, recording from one group of TRN neurones before, during and after cortical ES. Three epochs are depicted: before (a), during (b) and after (c) the cortical ES.

References

    1. Anderson LA, Malmierca MS, Wallace MN, Palmer AR. Evidence for a direct, short latency projection from the dorsal cochlear nucleus to the auditory thalamus in the guinea pig. Eur J Neurosci. 2006;24:491–498. - PubMed
    1. Bal T, Debay D, Destexhe A. Cortical feedback controls the frequency and synchrony of oscillations in the visual thalamus. J Neurosci. 2000;20:7478–7488. - PMC - PubMed
    1. Bal T, McCormick DA. Mechanisms of oscillatory activity in guinea-pig nucleus reticularis thalami in vitro: a mammalian pacemaker. J Physiol. 1993;468:669–691. - PMC - PubMed
    1. Cotillon N, Edeline J-M. Tone-evoked oscillation in the rat auditory cortex result from interactions between the thalamus and reticular nucleus. Eur J Neurosci. 2000;12:3637–3650. - PubMed
    1. Cotillon-William N, Edeline J-M. Evoked oscillation in the thalamo-cortical auditory system are present in anesthetized but not in unanesthetized rats. J Neurophysiol. 2003;89:1968–1984. - PubMed

Publication types