Comparative Study
. 2007 Sep 14:8:320.
doi: 10.1186/1471-2164-8-320.

The extracellular leucine-rich repeat superfamily; a comparative survey and analysis of evolutionary relationships and expression patterns

Affiliations
Comparative Study

The extracellular leucine-rich repeat superfamily; a comparative survey and analysis of evolutionary relationships and expression patterns

Jackie Dolan et al. BMC Genomics. .

Erratum in

  • BMC Genomics. 2009;10:230

Abstract

Background: Leucine-rich repeats (LRRs) are highly versatile and evolvable protein-ligand interaction motifs found in a large number of proteins with diverse functions, including innate immunity and nervous system development. Here we catalogue all of the extracellular LRR (eLRR) proteins in worms, flies, mice and humans. We use convergent evidence from several transmembrane-prediction and motif-detection programs, including a customised algorithm, LRRscan, to identify eLRR proteins, and a hierarchical clustering method based on TribeMCL to establish their evolutionary relationships.

Results: This yields a total of 369 proteins (29 in worm, 66 in fly, 135 in mouse and 139 in human), many of them of unknown function. We group eLRR proteins into several classes: those with only LRRs, those that cluster with Toll-like receptors (Tlrs), those with immunoglobulin or fibronectin-type 3 (FN3) domains and those with some other domain. These groups show differential patterns of expansion and diversification across species. Our analyses reveal several clusters of novel genes, including two Elfn genes, encoding transmembrane proteins with eLRRs and an FN3 domain, and six genes encoding transmembrane proteins with eLRRs only (the Elron cluster). Many of these are expressed in discrete patterns in the developing mouse brain, notably in the thalamus and cortex. We have also identified a number of novel fly eLRR proteins with discrete expression in the embryonic nervous system.

Conclusion: This study provides the necessary foundation for a systematic analysis of the functions of this class of genes, which are likely to include prominently innate immunity, inflammation and neural development, especially the specification of neuronal connectivity.


Figures

Figure 1
Figure 1
Bioinformatics pipeline. Figure shows starting datasets (blue), annotation programs (green) and clustering pipeline (orange) used to generate final eLRR dataset.
Figure 2
Figure 2
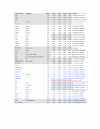
Sample from list of all eLRR genes, hierarchically clustered at e-40 cutoff. Proteins have been sorted in this table based on the clustering output from TribeMCL. This has been done hierarchically across inflation parameters, starting at 1.2, then 2, 3, 4 and 5. For most proteins this yields a tree-like structure with cluster stringency increasing (and membership decreasing) from low inflation parameters to high. Numbers used to identify clusters are generated by TribeMCL with larger clusters having lower numbers. Proteins are colour-coded by species: black, mammalian; blue, fly; red, worm. For the mammalian proteins, only the mouse orthologue is listed. The table shows examples of clusters in the LRR_Ig/FN3 group with mouse, fly and worm orthologues (the Lrig subfamily) and with mouse paralogues only (the Lrrn6, Lrrn1–3 and Lrrc4 subfamilies, which cluster together at level 1.2). It also shows many of the proteins in the LRR_Tollkin group, with the hierarchical clustering apparent across inflation parameters and indicated by shading. One subfamily containing a known and novel member is shown at the bottom. Proteins encoded by genes located in tandem in the genome are boxed in the right-hand column. A complete list of all eLRR proteins is provided [see Additional File 3]. Lists clustered at the e-25 and e-10 cutoff levels are given [see Additional Files 4 and 5].
Figure 3
Figure 3
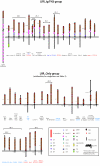
eLRR protein predicted architectures (part 1). Consensus architectures are shown for all proteins in the LRR_Ig/FN3 group and for all proteins in subfamilies in the LRR_Only group. An additional set of LRR_Only singletons is listed separately in Table 1. Protein names are shown below the corresponding structures (black, mammalian; blue, fly; red, worm). All figures are drawn to scale (see Key). Consensus architectures were derived for single proteins and across subfamilies from convergent evidence from motif and topology prediction programmes. Where there is a range in number of predicted LRRs or other domains across members of a subfamily, this is indicated next to the domain. A range in length of the cytoplasmic domain is similarly indicated, where it exceeds 20 amino acids. Tightly clustered subfamilies (e.g., Slits, Amigos) are listed under a single consensus architecture. Clusters with more structurally diverse proteins are indicated by the brackets; the numbers refer to e-value and inflation parameter at which the proteins cluster in the MCL programme. See Key for more information.
Figure 4
Figure 4
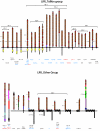
eLRR protein predicted architectures (part 2). Consensus architectures are shown for all proteins in the LRR_Tollkin and LRR_Other groups. See Figure 3 legend for details.
Figure 5
Figure 5
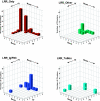
Group-specific patterns of expansion and diversification. The graphs depict three-dimensional histograms showing the number of clusters (on the z axis) having x members in the fly and y members in the mouse. The clusters used for this analysis are listed [see Additional File 6]. Different patterns of expansion (new members in one species of a conserved subfamily) and diversification (novel subfamilies in one species) are observed across the four major groups of eLRR proteins. Graphs were generated with the SPSS program.
Figure 6
Figure 6
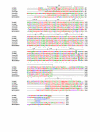
Alignment of Elfn proteins. Predicted amino acid sequences from Elfn1 (A930017N06Rik) and Elfn2 (Lrrc62) from the mouse were aligned with CLUSTALW. Amino acids are colour-coded by chemical properties: blue: acidic; green: hydroxyl/amine/basic/Q; magenta: basic; red: small, hydrophobic (including aliphatic Y). Brackets indicate the extent of predicted motifs, including signal sequence (SS), six LRRs (the notch under the bracket indicates the end of the conserved N-terminal portion of each LRR), LRR-CT domain, fibronectin type-3 (FN3) domain and a transmembrane domain (TM). No recognizable LRR-NT domain was predicted. Note that the final LRR comprises the highly conserved N-terminal half-repeat only (consensus: LxxLxxLxLxxN). Identical residues are indicated by an asterisk, highly conservative substitutions by two dots and conservative substitutions by a single dot.
Figure 7
Figure 7
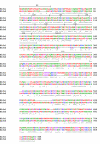
Alignment of proteins in Elron cluster. Predicted amino acid sequences from Lrtm1, Lrtm2, Lrrc38, Lrrc55, Lrrc52 and BC004853 from the mouse were aligned with CLUSTALW. Brackets indicate the extent of predicted motifs (consensus limits are shown); the notch under the bracket indicates the end of the conserved N-terminal portion of each LRR. Arrowheads denote exon-intron boundaries. The short cytoplasmic domain is poorly conserved, but does contain similarly positioned acidic residues (E/D) in all members. Lrtm1 and 2 end in consensus PDZ-binding domains (SSSA/SSVA), underlined. Abbreviations, amino acid colour-code and conservation symbols as in Figure 7.
Figure 8
Figure 8
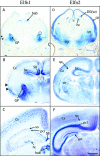
Expression of Elfn genes in developing mouse brain. Expression as defined by RNA in situ hybridisation is shown for Elfn1 (A-C) and Elfn2 (D-F) in coronal sections of mouse brain at three ages (embryonic day 15 (E15), A, D; postnatal day zero (P0), B, E; and postnatal day 9 (P9), C, F). Elfn1 is strongly expressed in globus pallidus and interneurons in cortex and hippocampus, while Elfn2 is expressed in striatum and in projection neurons in cortex and hippocampus. Arrowheads in A and B indicate presumed interneurons migrating towards cortex. Abbreviations: cp, cortical plate; Cx, cortex; DG(vz), ventricular zone of dentate gyrus; gcl, granule cell layer (of dentate gyrus); GP, globus pallidus; hab, habenula; hc, hippocampus; hi, hilus (of dentate gyrus); hy, hypothalamus; pcl; pyramidal cell layer (of hippocampus); SB, subiculum; sp, subplate; so, stratum oriens (of hippocampus), str, striatum. Scale bar: E15, 200 microns; P0 and P9, 500 microns.
Figure 9
Figure 9
Expression of Elron cluster genes in developing mouse brain. Expression as defined by RNA in situ hybridisation is shown for Lrtm1 (A, B), Lrtm2 (C, D) and Lrrc55 (E, F) in coronal sections of mouse brain at two ages (E15, A, C, E and P0, B, D, F). Differential staining in subsets of thalamic nuclei and across cortex is observed. Abbreviations: Am, amygdala; dLGN, dorsal lateral geniculate nucleus; dTh, dorsal thalamus; hab, habenula; hc, hippocampus; RS, retrosplenial cortex; sp, subplate; str, striatum; vLGN, ventral lateral geniculate nucleus; ZI, zona incerta. Scale bar: E15, 200 microns; P0, 500 microns.
Figure 10
Figure 10
Expression of novel eLRR genes in the Drosophila embryo. (A) A lateral view of a stage 12 embryo showing expression of CG7702 in the midgut and the peripheral nervous system, PNS expression is indicated by a black arrow. (B) CG40500 expression in a stage 16 embryo, expression can be seen at the midline (indicated by a black arrow). (C and D) Lateral and ventral views, respectively, of a stage 15 embryo showing CG11910 expression in the central nervous system. (E) A stage 16 embryo with CG5888 expression in the CNS and midgut chamber, midgut chamber is indicated by a black arrow. (F) A dissected ventral nerve cord fillet with CG5888 expression (shown at 400× magnification). (G) A stage 11 embryo showing CG11136 expression at the midline, indicated by a white arrow and (H) a stage 15 embryo showing expression of CG11136 in the somatic musculature. All whole embryos are shown at 200× magnification. In all views anterior is to the left, in all lateral views dorsal is at the top, B, D and E show ventral views and G shows a dorsal view.

References

    1. Kobe B, Kajava AV. The leucine-rich repeat as a protein recognition motif. Curr Opin Struct Biol. 2001;11:725–32. doi: 10.1016/S0959-440X(01)00266-4. - DOI - PubMed
    1. Nurnberger T, Brunner F, Kemmerling B, Piater L. Innate immunity in plants and animals: striking similarities and obvious differences. Immunol Rev. 2004;198:249–66. doi: 10.1111/j.0105-2896.2004.0119.x. - DOI - PubMed
    1. Chen Y, Aulia S, Li L, Tang BL. AMIGO and friends: An emerging family of brain-enriched, neuronal growth modulating, type I transmembrane proteins with leucine-rich repeats (LRR) and cell adhesion molecule motifs. Brain Res Brain Res Rev. 2006;51:265–74. doi: 10.1016/j.brainresrev.2005.11.005. - DOI - PubMed
    1. Kajava AV. Structural diversity of leucine-rich repeat proteins. J Mol Biol. 1998;277:519–27. doi: 10.1006/jmbi.1998.1643. - DOI - PubMed
    1. Bell JK, Botos I, Hall PR, Askins J, Shiloach J, Segal DM, Davies DR. The molecular structure of the Toll-like receptor 3 ligand-binding domain. Proc Natl Acad Sci USA. 2005;102:10976–80. doi: 10.1073/pnas.0505077102. - DOI - PMC - PubMed

Publication types

MeSH terms

LinkOut - more resources