. 2007 Sep 14:8:340.
doi: 10.1186/1471-2105-8-340.

Impact of image segmentation on high-content screening data quality for SK-BR-3 cells

Affiliations

Impact of image segmentation on high-content screening data quality for SK-BR-3 cells

Andrew A Hill et al. BMC Bioinformatics. .

Abstract

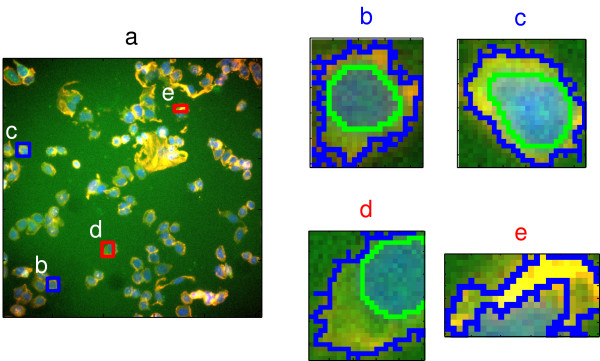
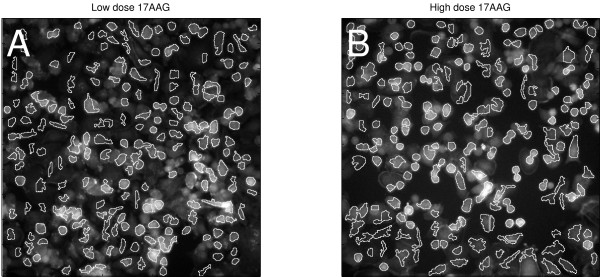
Background: High content screening (HCS) is a powerful method for the exploration of cellular signalling and morphology that is rapidly being adopted in cancer research. HCS uses automated microscopy to collect images of cultured cells. The images are subjected to segmentation algorithms to identify cellular structures and quantitate their morphology, for hundreds to millions of individual cells. However, image analysis may be imperfect, especially for "HCS-unfriendly" cell lines whose morphology is not well handled by current image segmentation algorithms. We asked if segmentation errors were common for a clinically relevant cell line, if such errors had measurable effects on the data, and if HCS data could be improved by automated identification of well-segmented cells.

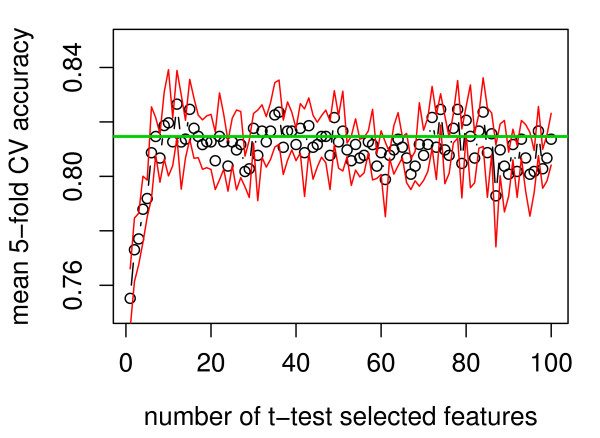
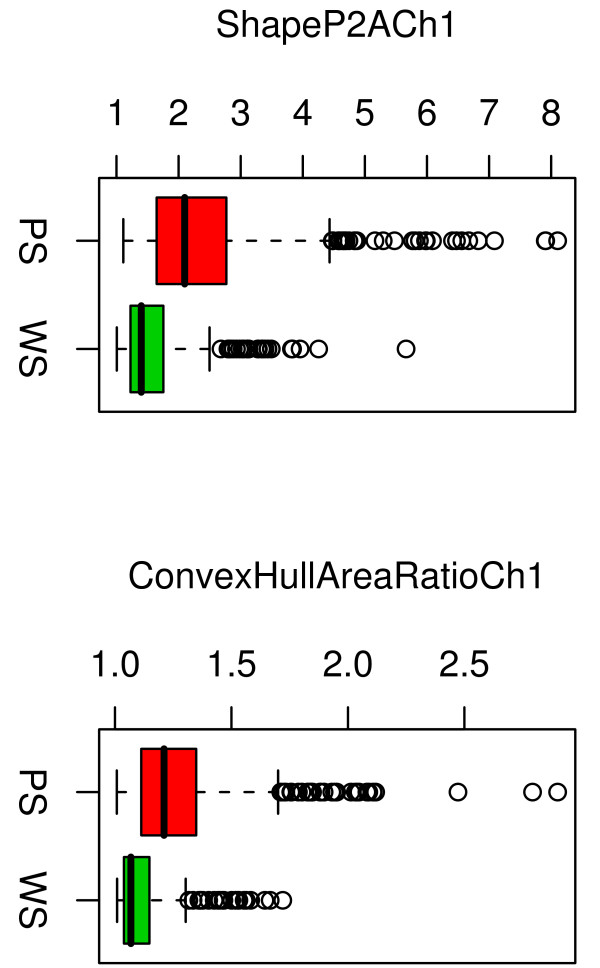
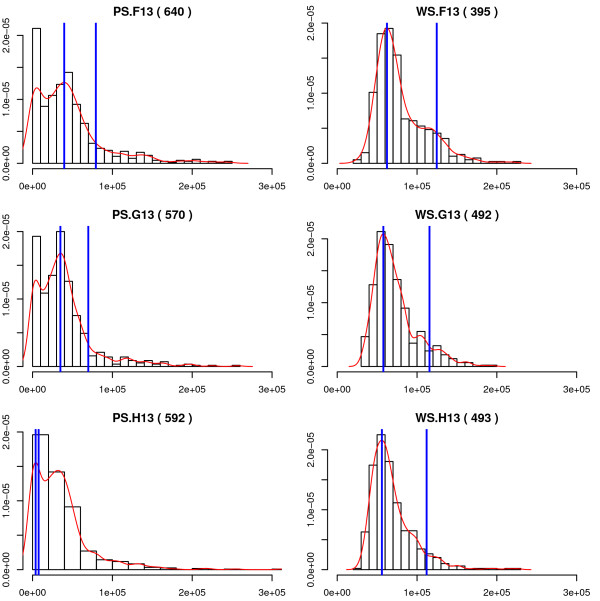
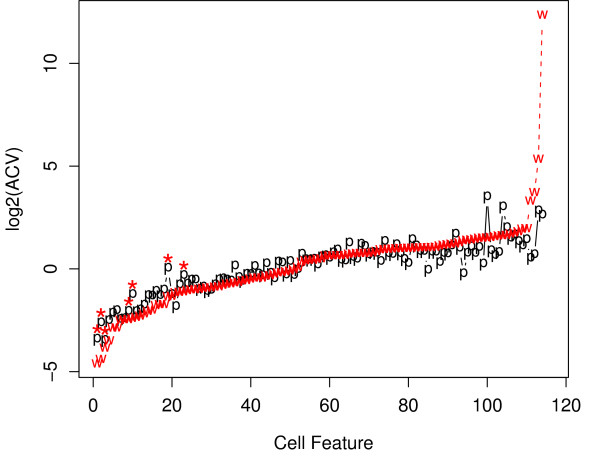
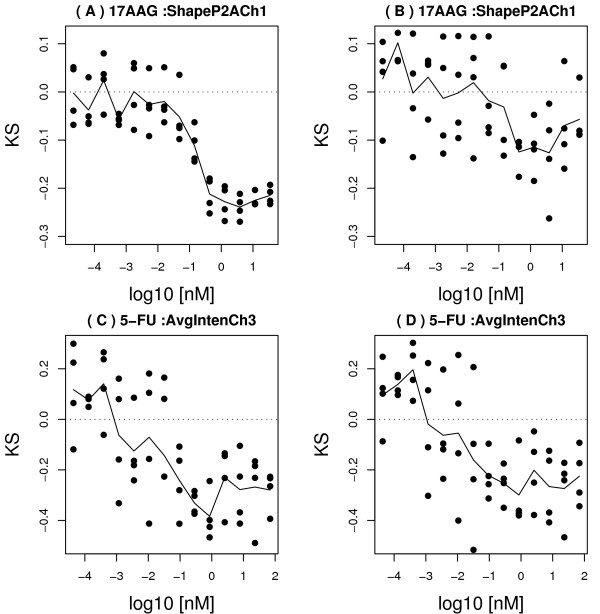
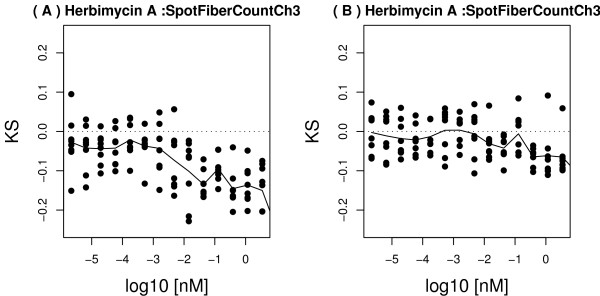
Results: Cases of poor cell body segmentation occurred frequently for the SK-BR-3 cell line. We trained classifiers to identify SK-BR-3 cells that were well segmented. On an independent test set created by human review of cell images, our optimal support-vector machine classifier identified well-segmented cells with 81% accuracy. The dose responses of morphological features were measurably different in well- and poorly-segmented populations. Elimination of the poorly-segmented cell population increased the purity of DNA content distributions, while appropriately retaining biological heterogeneity, and simultaneously increasing our ability to resolve specific morphological changes in perturbed cells.

Conclusion: Image segmentation has a measurable impact on HCS data. The application of a multivariate shape-based filter to identify well-segmented cells improved HCS data quality for an HCS-unfriendly cell line, and could be a valuable post-processing step for some HCS datasets.


Figures

Figure 1
Figure 1
Image segmentation is imperfect. (a) Representative composite image from the training image set. Bounding boxes determined from cell-body stain are indicated for segmented objects that were classed by human review as either poorly segmented (red boxes) or well segmented (blue boxes). Letters (b-e) indicate individual segmented objects. Nuclear stain (DAPI) is blue; Cell body (CMFDA) is green; Actin is red. (b-c) Magnified images of well-segmented objects containing a complete nucleus and cytoplasmic region. Green outlines indicate segmented nuclei; blue outlines delimit the segmented cell body. (d-e) Magnified images of poorly-segmented objects containing partial cell bodies and nuclei.
Figure 2
Figure 2
Cross validation indicates a small number of morphological shape features are sufficient to distinguish well- and poorly-segmented objects. Five-fold cross validation was executed on the training set, including feature selection in each round of training. Fraction of correctly classified training cases (from a total of 1009) is shown as a function of the number of morphological features in the SVM-RBF classifier. The open circles indicate mean accuracy; the red lines delimit one standard error around the mean. The green horizontal line marks the accuracy for 7 features, which was the minimal number of features for which the accuracy was within one SEM of the maximum.
Figure 3
Figure 3
Shape parameters of poorly-segmented (PS) and well-segmented (WS) cells. Data for 50 training cells is shown. Well-segmented objects tended to be more circular and less variable in shape than poorly-segmented objects.
Figure 4
Figure 4
DNA content of poorly-segmented (PS) and well-segmented (WS) objects. Each plot is a histogram of total DNA content from a single representative DMSO vehicle-treated well (F13, G13, or H13). The left column shows DNA content of poorly-segmented objects; well-segmented objects from the same wells are shown in the right column. The number in parentheses above each plot indicates the total number of objects included in the histogram. The red curve is a smoothed fit to the observed distribution. The blue lines were placed at the mode of the fitted distribution (the presumptive G0/G1 peak), and at twice the mode (the expected location of the G2/M peak). Note the poor estimates of the location of the G0/G1 peak in the poorly-segmented-class histograms, due to the large debris peak at small DNA content.
Figure 5
Figure 5
Variability in the well- and poorly-segmented populations. The absolute value of the coefficient of variation (ACV) was computed for each of the 116 morphological features, within well- and poorly-segmented populations from a representative set of DMSO-vehicle treated cultures. Each population contained approximately 3300–4000 cells. Features were sorted by their ACV in the well-segmented population for display purposes. The red line labelled "w" indicates ACV for features in the well-segmented population; the black line labelled "p" is ACV of the same features in the poorly segmented population. The asterisks indicate the 7 features that were used in the SVM-RBF classifier. The overall similarity in ACV between the two populations indicates that the well-segmented population retained significant biological variation of interest.
Figure 6
Figure 6
Examples of segmentation-sensitive and resistant cell-body features. Panels (A, B) show dose response of the KS statistic to the compound 17AAG, for the P2A feature in Channel 1, computed using only well-segmented cells (A), or only poorly segmented cells (B). A substantial difference is seen between the two responses for this "sensitive" feature. Panels (C, D) show dose response of KS statistic to the compound 5-FU, for the Average Intensity feature in Channel 3, computed using only well-segmented cells (C), or only poorly segmented cells (D). The two dose responses are similar for this "resistant" feature.
Figure 7
Figure 7
Effect of 17AAG on cell shape. Grayscale images in Channel 1 are shown. (A) Cells after exposure to low dose (0.02 pM) 17AAG. (B) After exposure to high dose (35 nM) 17AAG. White overlay shows the segmented cell body regions.
Figure 8
Figure 8
Examples of segmentation-sensitive and resistant actin-channel features. The dose response of the KS statistic to the compound Herbimycin A, for the FiberCount feature in Channel 3, computed using only well-segmented cells (A), or only poorly segmented cells (B).
Figure 9
Figure 9
Effect of Herbimycin on actin fiber morphology. Grayscale images in Channel 3 are shown. (a) Cells after exposure to low dose Herbimycin. (b) After exposure to high dose Herbimycin. White overlays show the segmented actin fiber objects.

Similar articles

Cited by

References

    1. Benson JD, Chen YN, Cornell-Kennon SA, Dorsch M, Kim S, Leszczyniecka M, Sellers WR, Lengauer C. Validating cancer drug targets. [Review] [57 refs] Nature. 441:451–456. doi: 10.1038/nature04873. - DOI - PubMed
    1. Bergman I, Barmada MA, Griffin JA, Slamon DJ. Treatment of meningeal breast cancer xenografts in the rat using an anti-p185/HER2 antibody. Clinical Cancer Research. 2001;7:2050–2056. - PubMed
    1. De Lorenzo C, Palmer DB, Piccoli R, Ritter MA, D'Alessio G. Clinical Cancer Research. Vol. 8. 2002; A new human antitumor immunoreagent specific for ErbB2; pp. 1710–1719. - PubMed
    1. Lee S, Yang W, Lan KH, Sellappan S, Klos K, Hortobagyi G, Hung MC, Yu D. Cancer Res. Vol. 62. 2002; Enhanced sensitization to taxol-induced apoptosis by herceptin pretreatment in ErbB2-overexpressing breast cancer cells; pp. 5703–5710. - PubMed
    1. Giuliano KA, DeBiasio RL, Dunlay RT, Gough A, Volosky JM, Zock J, Pavlakis GN, Taylor DL. High-Content Screening: A New Approach to Easing Key Bottlenecks in the Drug Discovery Process. J Biomol Screen. 1997;2:249–259. doi: 10.1177/108705719700200410. - DOI