. 2007;8(9):R191.
doi: 10.1186/gb-2007-8-9-r191.

Characterization of heterotypic interaction effects in vitro to deconvolute global gene expression profiles in cancer

Affiliations

Characterization of heterotypic interaction effects in vitro to deconvolute global gene expression profiles in cancer

Martin Buess et al. Genome Biol. 2007.

Abstract

Background: Perturbations in cell-cell interactions are a key feature of cancer. However, little is known about the systematic effects of cell-cell interaction on global gene expression in cancer.

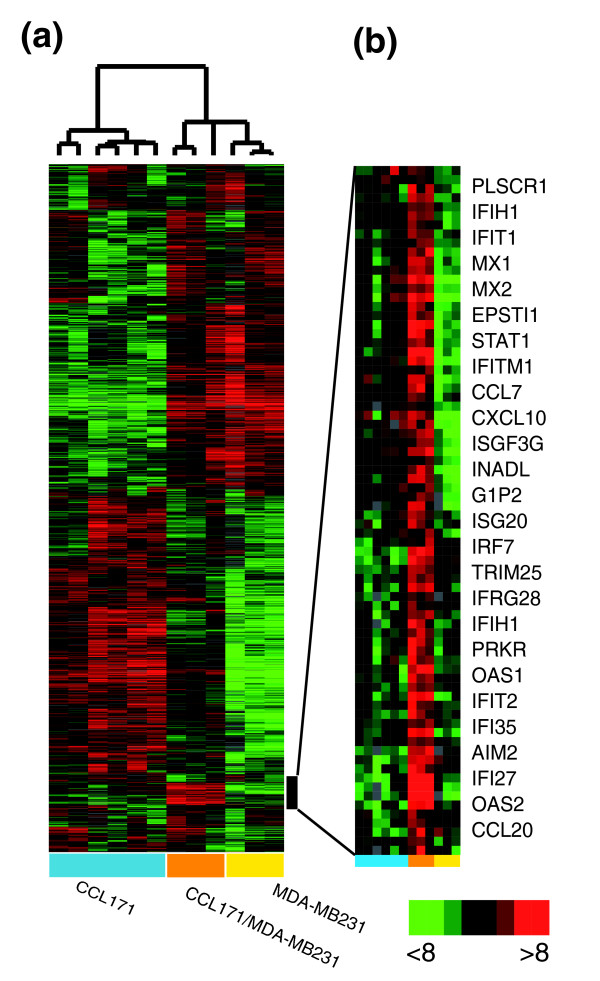
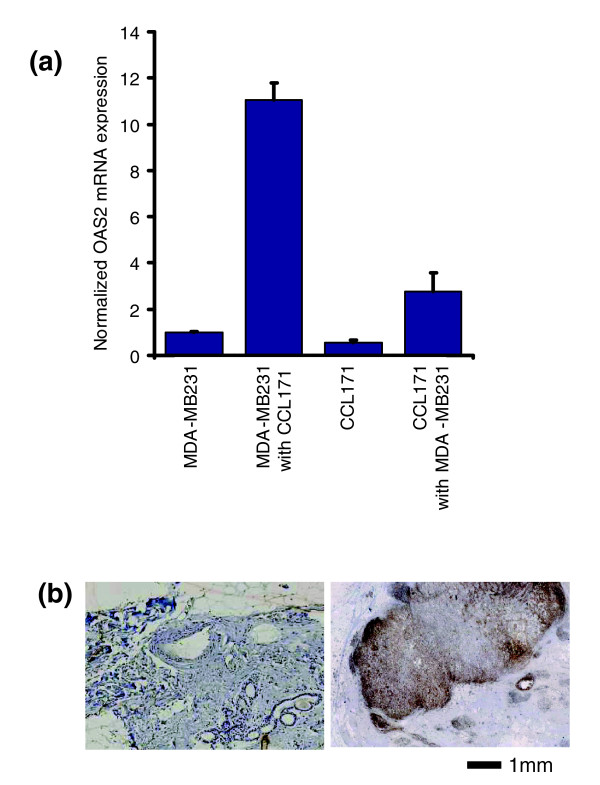
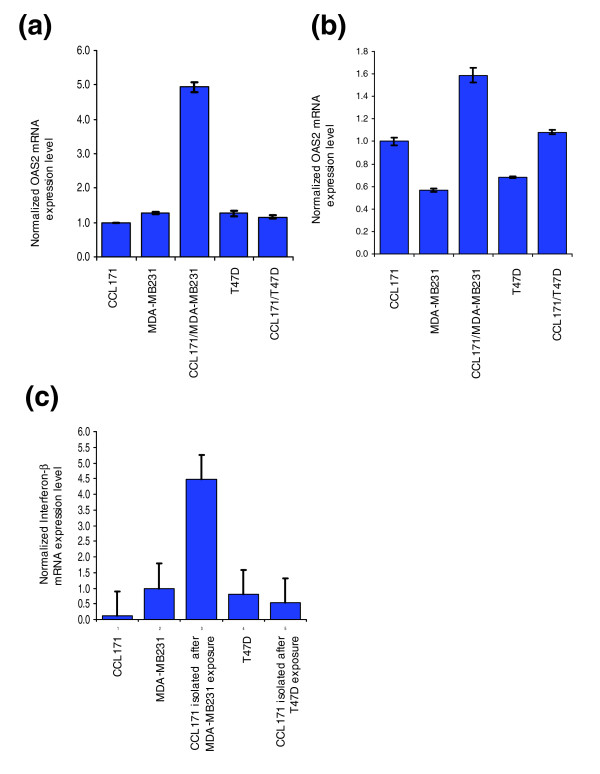
Results: We used an ex vivo model to simulate tumor-stroma interaction by systematically co-cultivating breast cancer cells with stromal fibroblasts and determined associated gene expression changes with cDNA microarrays. In the complex picture of epithelial-mesenchymal interaction effects, a prominent characteristic was an induction of interferon-response genes (IRGs) in a subset of cancer cells. In close proximity to these cancer cells, the fibroblasts secreted type I interferons, which, in turn, induced expression of the IRGs in the tumor cells. Paralleling this model, immunohistochemical analysis of human breast cancer tissues showed that STAT1, the key transcriptional activator of the IRGs, and itself an IRG, was expressed in a subset of the cancers, with a striking pattern of elevated expression in the cancer cells in close proximity to the stroma. In vivo, expression of the IRGs was remarkably coherent, providing a basis for segregation of 295 early-stage breast cancers into two groups. Tumors with high compared to low expression levels of IRGs were associated with significantly shorter overall survival; 59% versus 80% at 10 years (log-rank p = 0.001).

Conclusion: In an effort to deconvolute global gene expression profiles of breast cancer by systematic characterization of heterotypic interaction effects in vitro, we found that an interaction between some breast cancer cells and stromal fibroblasts can induce an interferon-response, and that this response may be associated with a greater propensity for tumor progression.


Figures

Figure 1
Figure 1
Effect of heterotypic interaction between breast cancer cell line MDA-MB231 and CCL-171 fibroblasts. (a) Biologically independent replicates of the monocultured fibroblast CCL-171, the breast cancer cell line MDA-MB231 and the mixed co-culture of CCL-171 and MDA-MB231 were grown for 48 h at low serum conditions and characterized by DNA microarray hybridization. Hierarchical clustering of a total of 4,333 elements that display a greater than 3-fold variance in expression in more than 3 different experimental samples. Data from individual elements or genes are represented as single rows, and different experiments are shown as columns. Red and green denote expression levels of the samples. The intensity of the color reflects the magnitude of the deviation from baseline. Unsupervised hierarchical clustering of the experiments grouped the biological replicates together. Gene expression varied considerably between fibroblast and MDA-MB231 cultures, as expected for cells of mesenchymal or epithelial origin, respectively. The co-culture profile showed mainly intermediate expression levels. However, the vertical black bar marks a cluster of genes induced in all co-cultures compared to both monocultures, indicating that they are induced by heterotypic interaction. (b) Zooming in on the genes up-regulated in co-culture compared to monocultures reveals that they are associated with the response to interferon.
Figure 2
Figure 2
Overview of gene expression changes over multiple co-cultures of breast cancer cell lines and normal breast epithelial cells with fibroblasts. (a) Correlation of the measured co-culture gene expression levels and their estimated expression levels based on the proportional contribution of each cell type determined by a linear regression fit of the monoculture to the co-culture data. (b) Fold change of each gene associated with co-culturing of MDA-MB231 and CCL-171. Genes of the interferon response gene set (Additional data file 1) as determined by SAM are indicated in red. (c) Fold change in expression of the interferon response gene set (Additional data file 1) in co-culture of MCF-7, HMECs and MDA-MB-231 with either the CCL-171 lung fibroblast or the HTB-125 breast fibroblast, showing that CCL-171 and HTB-125 induce a distinct, but very similar response in co-culture with different epithelial cells. (d) Overview of collapsed data from repeat co-culture experiments of eight benign and malignant epithelial cells with three different fibroblasts. Hierarchical clustering of the interaction effects of 3,000 genes in co-cultures of 7 breast cancer cell lines and normal breast epithelial cells with fibroblasts. Red and green denote relative changes in expression associated heterotypic interaction. The magnitude of the relative change is given by color intensity.
Figure 3
Figure 3
Interferon response gene induction in co-cultivated cells. (a) MDA-MB231 breast cancer cells and CCL-171 fibroblasts were labeled before co-culture with the fluorescent carbocyanine dye DiO and isolated after co-culture using FACS, which allowed a purification of 95%. Comparing gene expression patterns of the cells cultivated in monoculture to the same cell type after co-cultivation showed that the CCL-171 fibroblasts up-regulate the interferon response genes 2.8-fold on average, whereas the MDA-MB-231 breast cancer cell line up-regulates them about 11-fold. (b) Immunohistochemistry for STAT1. STAT1 expression in a normal breast (left panel) and in a breast cancer specimen (right panel). STAT1 is predominantly expressed in the malignant epithelial cells at the stromal interface in a centrifugal gradient.
Figure 4
Figure 4
Induction of interferon response in two types of breast cancer cell lines. (a) MDA-MB231 cells were incubated in conditioned media from CCL-171 monoculture, MDA-MB231 monoculture, T47D monoculture, CCL-171/MDA-MB231 co-culture and CCL-171/T47D co-culture. OAS2 gene expression was determined by quantitative RT-PCR. The gene expression level of GAPDH was used for normalization between the samples. A strong induction of OAS2 by the supernatant from the CCL-171/MDA-MB231 co-culture can be seen in MDA-MB231. (b) Incubation of T47D cells with conditioned media from CCL-171 monoculture, MDA-MB231 monoculture, T47D monoculture, CCL-171/MDA-MB231 co-culture and CCL-171/T47D co-culture showed that only the CCL-171/MDA-MB231 co-culture supernatant induced OAS2 gene expression, although to a much lesser extent than in MDA-MB231 cells. (c) Gene expression levels of IFNβ were determined by quantitative RT-PCR. CCL-171 cells show much higher IFNβ expression levels when isolated by FACS after co-culture with MDA-MB231 than with T47D cells. Expression levels in tumor cells are shown as controls. The error bars show the standard deviation from the normalized mean.
Figure 5
Figure 5
Model of interaction effects. Upon close cell-cell contact the tumor cells (red) interact with the fibroblasts (yellow) (1), which express type I interferon (IFNα and IFNβ) (2). They in turn induce the interferon response genes predominantly in the tumor cells (3).
Figure 6
Figure 6
Interferon response gene expression in early stage breast cancer (a) The expression values of genes in the 'interferon response gene set' were extracted from a published expression study of 295 early stage breast cancers from the Netherlands Cancer Institute [35]. Genes and samples are organized by hierarchical clustering. The tumors segregated into two groups defined by high (red) or low (blue) expression levels of 29 genes matching the 'interferon response gene set'. (b) Correlation of interferon response with distant metastasis free and overall survival. Kaplan-Meier curves for the clinical outcomes of indicated tumors exhibiting high (red curve) and low (blue curve) interferon responses are shown.
Figure 7
Figure 7
Correlation of the 70 genes signature [38], the wound signature [24], the hypoxia signature [25] and the interferon response score in the NKI dataset. Pairwise scatterplot-matrix of four gene signatures. Pearson correlations are shown in the lower part of each plot.
Figure 8
Figure 8
Immunohistochemical staining of STAT1 in a cohort of primary breast cancers: Kaplan-Meier disease-specific survival curve for 353 primary tumors assessed for STAT1. The red curve shows 102 patients bearing tumors with high STAT1 expression whereas the blue curve represents 251 patients with low or absent STAT1 expression. X = censored data.

References

    1. Cunha GR, Hom YK. Role of mesenchymal-epithelial interactions in mammary gland development. J Mammary Gland Biol Neoplasia. 1996;1:21–35. doi: 10.1007/BF02096300. - DOI - PubMed
    1. Levine JF, Stockdale FE. Cell-cell interactions promote mammary epithelial cell differentiation. J Cell Biol. 1985;100:1415–1422. doi: 10.1083/jcb.100.5.1415. - DOI - PMC - PubMed
    1. Weaver M, Batts L, Hogan BL. Tissue interactions pattern the mesenchyme of the embryonic mouse lung. Dev Biol. 2003;258:169–184. doi: 10.1016/S0012-1606(03)00117-9. - DOI - PubMed
    1. Howlett AR, Bissell MJ. The influence of tissue microenvironment (stroma and extracellular matrix) on the development and function of mammary epithelium. Epithelial Cell Biol. 1993;2:79–89. - PubMed
    1. Howard B, Ashworth A. Signalling pathways implicated in early mammary gland morphogenesis and breast cancer. PLoS Genet. 2006;2:e112. doi: 10.1371/journal.pgen.0020112. - DOI - PMC - PubMed

Publication types