

Adaptive expression responses in the Pol-gamma null strain of S. pombe depleted of mitochondrial genome
- PMID: 17868468
- PMCID: PMC2045682
- DOI: 10.1186/1471-2164-8-323
Adaptive expression responses in the Pol-gamma null strain of S. pombe depleted of mitochondrial genome
Abstract
Background: DNA polymerase gamma(Pol-gamma) has been shown to be essential for maintenance of the mitochondrial genome (mtDNA) in the petite-positive budding yeast Saccharomyces cerevisiae. Budding yeast cells lacking mitochondria exhibit a slow-growing or petite-colony phenotype. Petite strains fail to grow on non-fermentable carbon sources. However, it is not clear whether the Pol-gamma is required for mtDNA maintenance in the petite-negative fission yeast Schizosaccharomyces pombe.
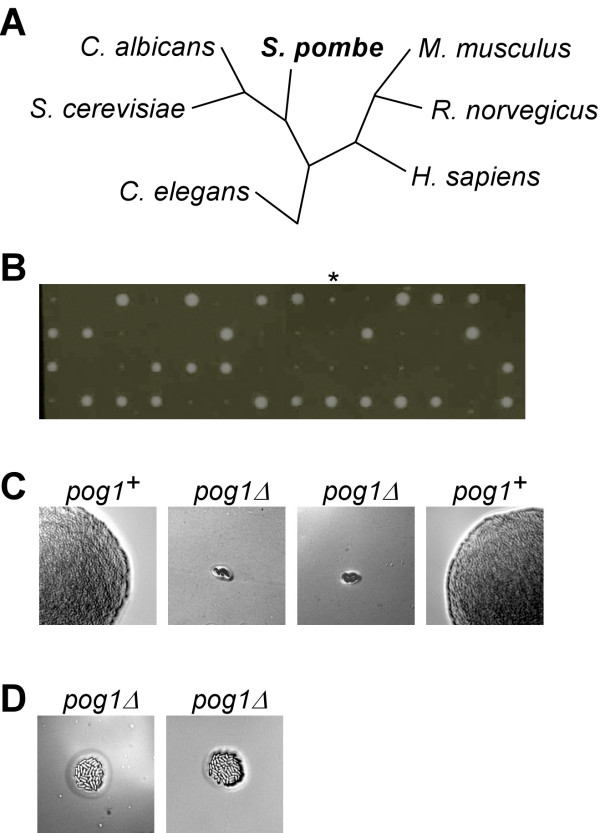
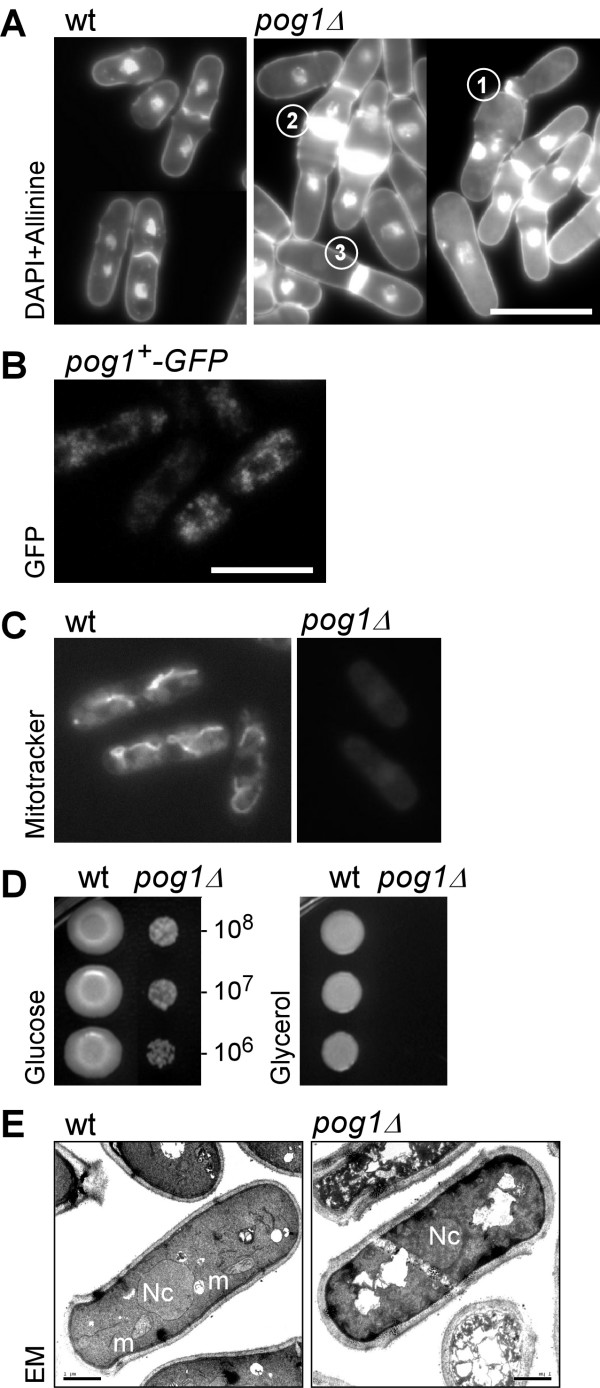
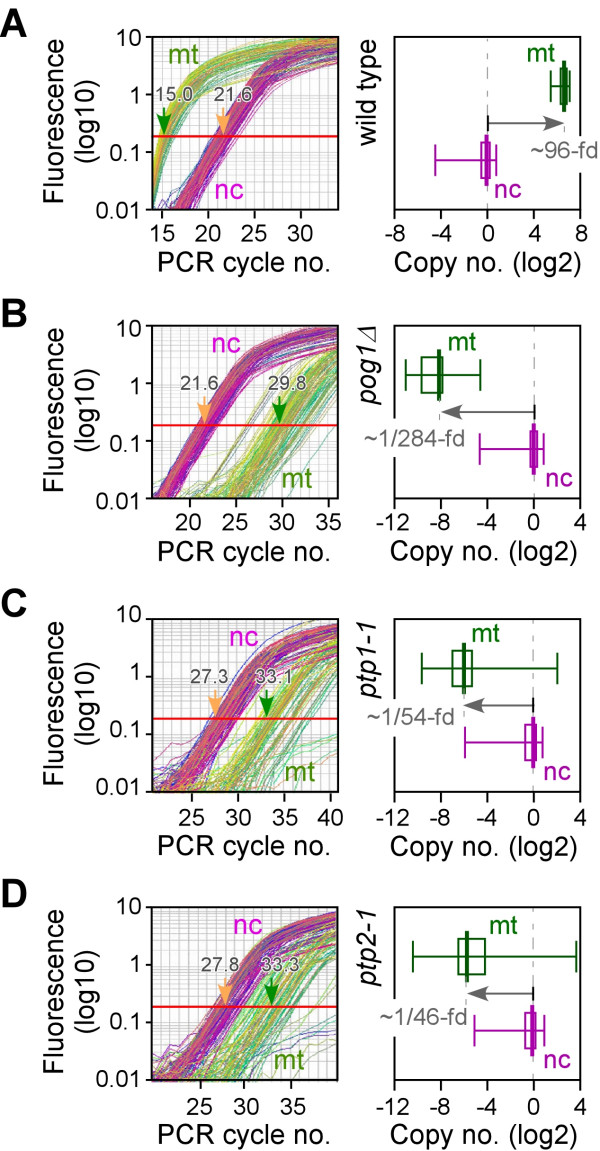
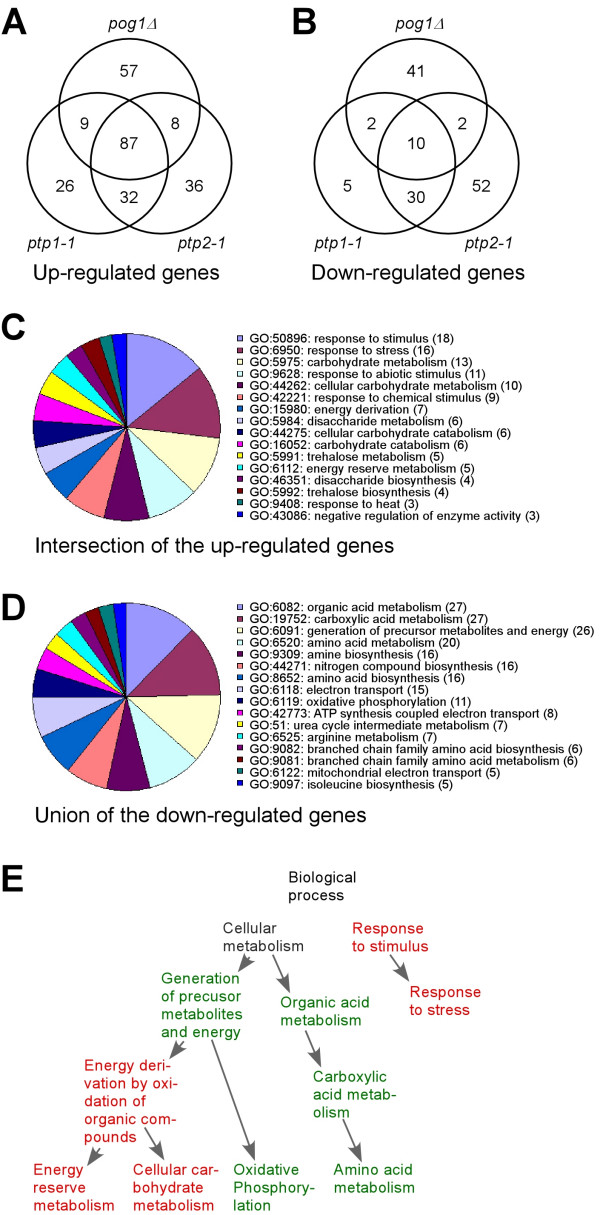
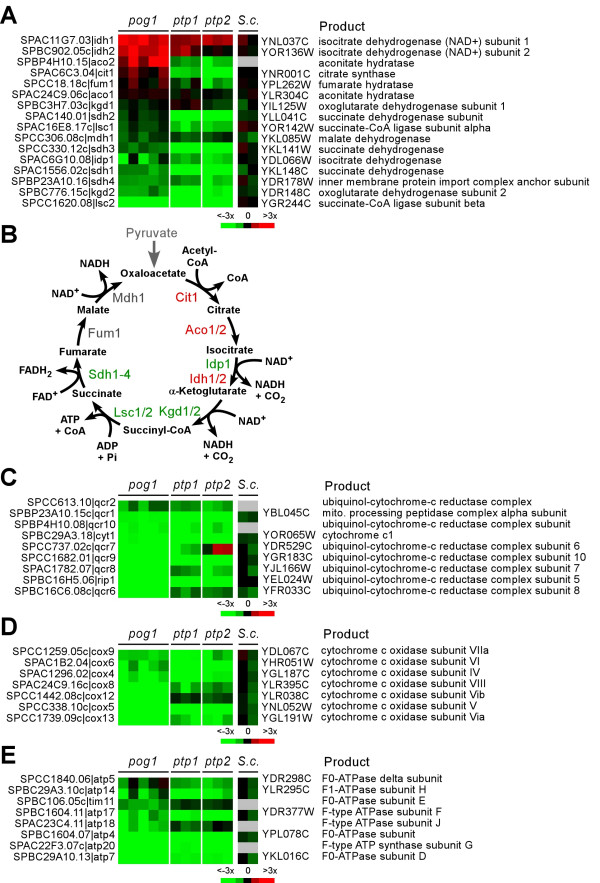
Results: We show that disruption of the nuclear gene pog1+ that encodes Pol-gamma is sufficient to deplete mtDNA in S. pombe. Cells bearing pog1Delta allele require substantial growth periods to form petite colonies. Mitotracker assays indicate that pog1Delta cells are defective in mitochondrial function and EM analyses suggest that pog1Delta cells lack normal mitochondrial structures. Depletion of mtDNA in pog1Delta cells is evident from quantitative real-time PCR assays. Genome-wide expression profiles of pog1Delta and other mtDNA-less cells reveal that many genes involved in response to stimulus, energy derivation by oxidation of organic compounds, cellular carbohydrate metabolism, and energy reserve metabolism are induced. Conversely, many genes encoding proteins involved in amino acid metabolism and oxidative phosphorylation are repressed.
Conclusion: By showing that Pol-gamma is essential for mtDNA maintenance and disruption of pog1+ alters the genome-wide expression profiles, we demonstrated that cells lacking mtDNA exhibit adaptive nuclear gene expression responses in the petite-negative S. pombe.
Figures
Similar articles
-
Expression of the Saccharomyces cerevisiae gene YME1 in the petite-negative yeast Schizosaccharomyces pombe converts it to petite-positive.Genetics. 2000 Jan;154(1):147-54. doi: 10.1093/genetics/154.1.147. Genetics. 2000. PMID: 10628976 Free PMC article.
-
Genetic conservation versus variability in mitochondria: the architecture of the mitochondrial genome in the petite-negative yeast Schizosaccharomyces pombe.Curr Genet. 2003 Aug;43(5):311-26. doi: 10.1007/s00294-003-0404-5. Epub 2003 May 9. Curr Genet. 2003. PMID: 12739049 Review.
-
Maintenance and integrity of the mitochondrial genome: a plethora of nuclear genes in the budding yeast.Microbiol Mol Biol Rev. 2000 Jun;64(2):281-315. doi: 10.1128/MMBR.64.2.281-315.2000. Microbiol Mol Biol Rev. 2000. PMID: 10839818 Free PMC article. Review.
-
The fission yeast Schizosaccharomyces pombe Mtf2 is required for mitochondrial cox1 gene expression.Microbiology (Reading). 2018 Mar;164(3):400-409. doi: 10.1099/mic.0.000602. Epub 2018 Jan 12. Microbiology (Reading). 2018. PMID: 29458562
-
Nuclear mutations in the petite-negative yeast Schizosaccharomyces pombe allow growth of cells lacking mitochondrial DNA.Genetics. 1992 Jun;131(2):255-60. doi: 10.1093/genetics/131.2.255. Genetics. 1992. PMID: 1644270 Free PMC article.
Cited by
-
Comparative Genomics of Serial Isolates of Cryptococcus neoformans Reveals Gene Associated With Carbon Utilization and Virulence.G3 (Bethesda). 2013 Apr 9;3(4):675-686. doi: 10.1534/g3.113.005660. G3 (Bethesda). 2013. PMID: 23550133 Free PMC article.
-
The Identification of the Mitochondrial DNA Polymerase γ (Mip1) of the Entomopathogenic Fungus Metarhizium brunneum.Microorganisms. 2024 May 23;12(6):1052. doi: 10.3390/microorganisms12061052. Microorganisms. 2024. PMID: 38930434 Free PMC article.
-
Genetic instability in budding and fission yeast-sources and mechanisms.FEMS Microbiol Rev. 2015 Nov;39(6):917-67. doi: 10.1093/femsre/fuv028. Epub 2015 Jun 24. FEMS Microbiol Rev. 2015. PMID: 26109598 Free PMC article. Review.
-
Pro-aging effects of glucose signaling through a G protein-coupled glucose receptor in fission yeast.PLoS Genet. 2009 Mar;5(3):e1000408. doi: 10.1371/journal.pgen.1000408. Epub 2009 Mar 6. PLoS Genet. 2009. PMID: 19266076 Free PMC article.
-
Accurate concentration control of mitochondria and nucleoids.Science. 2016 Jan 8;351(6269):169-72. doi: 10.1126/science.aaa8714. Science. 2016. PMID: 26744405 Free PMC article.
References
-
- Foury F. Cloning and sequencing of the nuclear gene MIP1 encoding the catalytic subunit of the yeast mitochondrial DNA polymerase. J Biol Chem. 1989;264:20552–20560. - PubMed
Publication types
MeSH terms
Substances
LinkOut - more resources
Full Text Sources
Molecular Biology Databases
