Comparative Study
. 2007 Sep 17:8:325.
doi: 10.1186/1471-2164-8-325.

Comparison of protein coding gene contents of the fungal phyla Pezizomycotina and Saccharomycotina

Affiliations
Comparative Study

Comparison of protein coding gene contents of the fungal phyla Pezizomycotina and Saccharomycotina

Mikko Arvas et al. BMC Genomics. .

Abstract

Background: Several dozen fungi encompassing traditional model organisms, industrial production organisms and human and plant pathogens have been sequenced recently and their particular genomic features analysed in detail. In addition comparative genomics has been used to analyse specific sub groups of fungi. Notably, analysis of the phylum Saccharomycotina has revealed major events of evolution such as the recent genome duplication and subsequent gene loss. However, little has been done to gain a comprehensive comparative view to the fungal kingdom. We have carried out a computational genome wide comparison of protein coding gene content of Saccharomycotina and Pezizomycotina, which include industrially important yeasts and filamentous fungi, respectively.

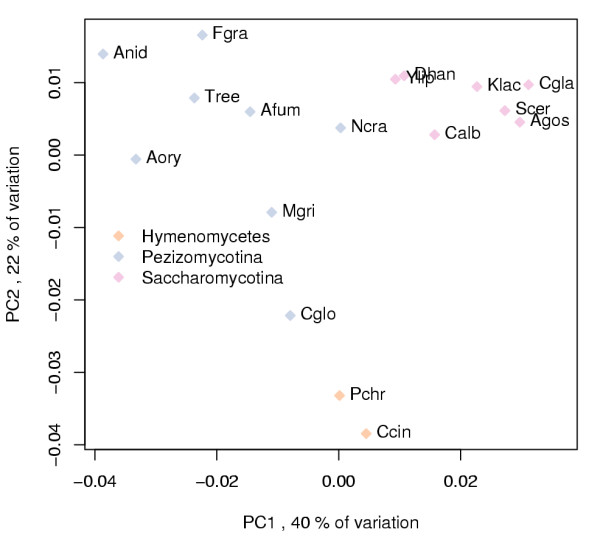
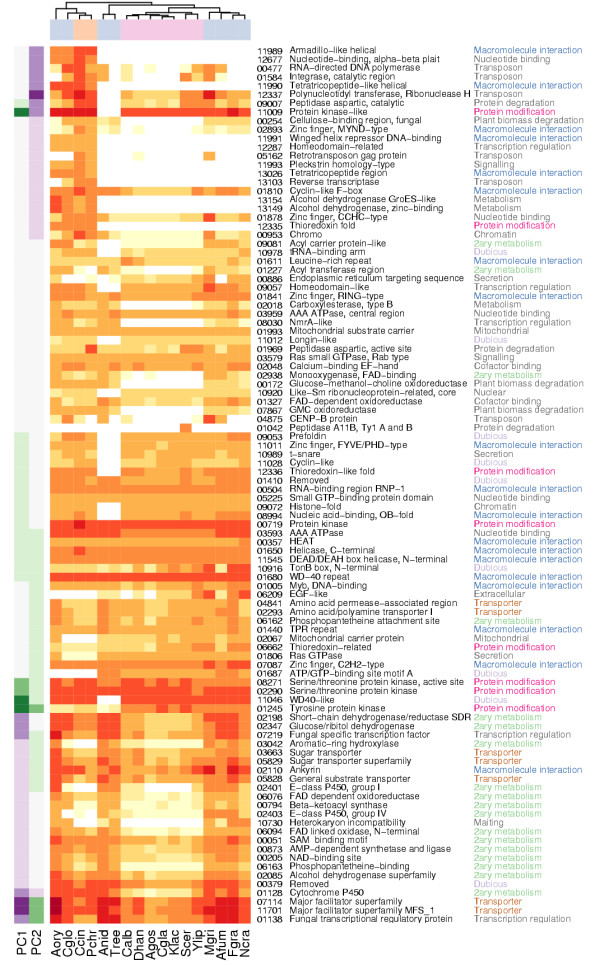
Results: Our analysis shows that based on genome redundancy, the traditional model organisms Saccharomyces cerevisiae and Neurospora crassa are exceptional among fungi. This can be explained by the recent genome duplication in S. cerevisiae and the repeat induced point mutation mechanism in N. crassa. Interestingly in Pezizomycotina a subset of protein families related to plant biomass degradation and secondary metabolism are the only ones showing signs of recent expansion. In addition, Pezizomycotina have a wealth of phylum specific poorly characterised genes with a wide variety of predicted functions. These genes are well conserved in Pezizomycotina, but show no signs of recent expansion. The genes found in all fungi except Saccharomycotina are slightly better characterised and predicted to encode mainly enzymes. The genes specific to Saccharomycotina are enriched in transcription and mitochondrion related functions. Especially mitochondrial ribosomal proteins seem to have diverged from those of Pezizomycotina. In addition, we highlight several individual gene families with interesting phylogenetic distributions.

Conclusion: Our analysis predicts that all Pezizomycotina unlike Saccharomycotina can potentially produce a wide variety of secondary metabolites and secreted enzymes and that the responsible gene families are likely to evolve fast. Both types of fungal products can be of commercial value, or on the other hand cause harm to humans. In addition, a great number of novel predicted and known enzymes are found from all fungi except Saccharomycotina. Therefore further studies and exploitation of fungal metabolism appears very promising.


Figures

Figure 1
Figure 1
Selection of the protein clustering parameter "inflation value" (r). Average sensitivity and specificity percentages (left y-axis) and total count and count of orphan clusters i.e. clusters with only a single member ORF (right y-axis) for clusterings made with different inflation values (x-axis).
Figure 2
Figure 2
Unrecognised by InterPro or clustering. Percentage of ORFs in orphan clusters (y-axis) versus the percentage of ORFs unrecognised by InterPro (x-axis) for species which were analysed with InterProScan. Species are coloured by phyla. Names of the species, plotted as abbreviations beside the data points, are explained in Table 1.
Figure 3
Figure 3
Genomic ORF redundancy. Percentage of ORFs in clusters containing more than one ORF from the species in question i.e. genomic ORF redundancy (y-axis) versus the size of the genome in ORFs (x-axis) for each species. See Figure 2 for further details.
Figure 4
Figure 4
Protein clustering overview. See Figure 5 for legend.
Figure 5
Figure 5
Legend for figure 4. A heatmap of clusters with at least ten ORFs. In the main heatmap colour intensity of a cell shows the number of ORFs shown by clusters (rows) and by species (columns). Both rows and columns are ordered by hierarchical clustering to group similar rows or columns together. The dendrogram from hierarchical clustering is shown for columns and the phylum of species is indicated by a column colour bar between the heatmap and the dendrogram. Under the heatmap each species is specified by an abbreviation explained in Table 1. On the left side of the main heatmap a black and white side heatmap shows the percentage of ORFs in a cluster that have an InterPro entry of all cluster's ORFs analysed with InterProScan ("wIPR"), cluster's stability and cluster's Saccharomycotina to Pezizomycotina ratio in a clustering where inflation value (r) was 1.1 ("S/P r 1.1"). Stability reflects the ratio of cluster size between a clustering where r = 3.1 to that where r = 1.1. As Figure 1 shows, when r is set to its minimum value (1.1), TRIBE-MCL clustering produces a minimum amount of clusters and orphan clusters. In consequence the clusters are on average larger when r = 1.1. The ratio between cluster size r = 3.1 and r = 1.1 is shown as a percentage. "S/P r 1.1" reflects the ratio of count of Saccharomycotina ORFs to Pezizomycotina ORFs in a cluster when r = 1.1. By comparing "S/P r 1.1" to the species distribution of a cluster shown on the main heatmap one can see if a cluster retains the Saccharomycotina to Pezizomycotina ratio when r = 1.1. On the right side of the main heatmap, a side heatmap shows various functional classifications for the clusters. Whether or not the cluster has a Funcat classification ("Funcat") or has an ORF found in S. cerevisiae metabolic model iMH805 is shown ("iMH805"). Whether the proteins in the cluster are predicted by Protfun to have a signal sequence directing them into either mitochondrion or secretion pathway ("TargetP"), have transmembrane domains ("TMHMM") or are predicted to be enzymes is shown ("Enz."). Clusters belonging to regions A: "Pezizomycotina abundant", B: "Pezizomycotina specific", C: "Saccharomycotina absent" and D: "Saccharomycotina unique" are specified by a vertical bar between main and right heatmap.
Figure 6
Figure 6
The KEGG metabolic pathway "Valine, leucine and isoleucine degradation". Enzymes found in S. cerevisiae according to SGD and KEGG are filled with green and in M. grisea according to KEGG circled in orange. Enzymes found in clusters corresponding to Funcat categories 01.01.11.02 -01.01.11.04 enriched in the region C: "Saccharomycotina absent" in Table 3 are filled with pink.
Figure 7
Figure 7
PCA of counts of ORFs with an InterPro entry. Positions of species analysed with InterProScan on the two PCs that explain the largest amount of variation in the counts of ORFs with an InterPro entry. Species abbreviations are explained in Table 1 and data points are coloured by phyla.
Figure 8
Figure 8
PCA loadings of InterPro entries and InterPro entry structures. PCA loadings of InterPro entries (a) or InterPro entry structures (b) of the two PCs that explain the largest amount of variation in the counts of ORFs with an InterPro entry. The PCA for InterPro entries (a) is shown in picture 11, for InterPro entry structures (b) data not shown. 100 InterPro entries or InterPro entry structures having the most extreme PCA loadings on the two PCs shown are coloured with orange (TOP 100), while the rest are 4373 InterPro entries and 16319 InterPro structures are in blue. InterPro entries identifiers are shown for 20 most extreme PCA loadings.
Figure 9
Figure 9
TOP 100 InterPro entries. See Figure 10 for legend.
Figure 10
Figure 10
Legend for figure 9. A heatmap of counts of ORFs with an InterPro entry for the TOP 100 entries from Figure 8a. In the main heatmap colour intensity of a cell shows the number of ORFs with an InterPro entry shown by entries (rows) and by species (columns). Both rows and columns are ordered by hierarchical clustering to group similar rows or columns together. Columns were clustered with counts of ORFs while rows were clustered with the entry PCA loadings (Left side heatmap and Figure 8a). The dendrogram from hierarchical clustering is shown for columns and the phylum of species is indicated by a column colour bar between the heatmap and the dendrogram. Under the heatmap each species is specified by an abbreviation explained in Table 1. Left side heatmap shows the loading of the entry as in Figure 8a. Interpro entry identifier ("IPR id.", "IPR0" removed from beginning), name ("IPR name") and "Author assignment" are shown for each entry. The "Author assignment" is an assignment to general themes that summarise the individual categories based on the InterPro database. While the other assignments are directly based on the InterPro, "Secondary metabolism" covers entries which are known to participate also in secondary metabolism ([61, 62] and InterPro). InterPro entries assigned to "Dubious" are entries that InterPro itself considers unreliable.
Figure 11
Figure 11
Schema and screenshots of the browsable fungal comparative genomics database. The schema on the upper right corner shows links between different browser views to the database. Additionally two example screenshots are shown. See text for further details.

Similar articles

Cited by

References

    1. Dujon B. Yeasts illustrate the molecular mechanisms of eukaryotic genome evolution. Trends Genet. 2006;22:375–387. doi: 10.1016/j.tig.2006.05.007. - DOI - PubMed
    1. Kellis M, Birren BW, Lander ES. Proof and evolutionary analysis of ancient genome duplication in the yeast Saccharomyces cerevisiae. Nature. 2004;428:617–624. doi: 10.1038/nature02424. - DOI - PubMed
    1. Dujon B, Sherman D, Fischer G, Durrens P, Casaregola S, Lafontaine I, De Montigny J, Marck C, Neuveglise C, Talla E, Goffard N, Frangeul L, Aigle M, Anthouard V, Babour A, Barbe V, Barnay S, Blanchin S, Beckerich JM, Beyne E, Bleykasten C, Boisrame A, Boyer J, Cattolico L, Confanioleri F, De Daruvar A, Despons L, Fabre E, Fairhead C, Ferry-Dumazet H, Groppi A, Hantraye F, Hennequin C, Jauniaux N, Joyet P, Kachouri R, Kerrest A, Koszul R, Lemaire M, Lesur I, Ma L, Muller H, Nicaud JM, Nikolski M, Oztas S, Ozier-Kalogeropoulos O, Pellenz S, Potier S, Richard GF, Straub ML, Suleau A, Swennen D, Tekaia F, Wesolowski-Louvel M, Westhof E, Wirth B, Zeniou-Meyer M, Zivanovic I, Bolotin-Fukuhara M, Thierry A, Bouchier C, Caudron B, Scarpelli C, Gaillardin C, Weissenbach J, Wincker P, Souciet JL. Genome evolution in yeasts. Nature. 2004;430:35–44. doi: 10.1038/nature02579. - DOI - PubMed
    1. Nierman WC, Pain A, Anderson MJ, Wortman JR, Kim HS, Arroyo J, Berriman M, Abe K, Archer DB, Bermejo C, Bennett J, Bowyer P, Chen D, Collins M, Coulsen R, Davies R, Dyer PS, Farman M, Fedorova N, Fedorova N, Feldblyum TV, Fischer R, Fosker N, Fraser A, Garcia JL, Garcia MJ, Goble A, Goldman GH, Gomi K, Griffith-Jones S, Gwilliam R, Haas B, Haas H, Harris D, Horiuchi H, Huang J, Humphray S, Jimenez J, Keller N, Khouri H, Kitamoto K, Kobayashi T, Konzack S, Kulkarni R, Kumagai T, Lafon A, Latge JP, Li W, Lord A, Lu C, Majoros WH, May GS, Miller BL, Mohamoud Y, Molina M, Monod M, Mouyna I, Mulligan S, Murphy L, O'Neil S, Paulsen I, Penalva MA, Pertea M, Price C, Pritchard BL, Quail MA, Rabbinowitsch E, Rawlins N, Rajandream MA, Reichard U, Renauld H, Robson GD, Rodriguez de Cordoba S, Rodriguez-Pena JM, Ronning CM, Rutter S, Salzberg SL, Sanchez M, Sanchez-Ferrero JC, Saunders D, Seeger K, Squares R, Squares S, Takeuchi M, Tekaia F, Turner G, Vazquez de Aldana CR, Weidman J, White O, Woodward J, Yu JH, Fraser C, Galagan JE, Asai K, Machida M, Hall N, Barrell B, Denning DW. Genomic sequence of the pathogenic and allergenic filamentous fungus Aspergillus fumigatus. Nature. 2005;438:1151–1156. doi: 10.1038/nature04332. - DOI - PubMed
    1. Machida M, Asai K, Sano M, Tanaka T, Kumagai T, Terai G, Kusumoto K, Arima T, Akita O, Kashiwagi Y, Abe K, Gomi K, Horiuchi H, Kitamoto K, Kobayashi T, Takeuchi M, Denning DW, Galagan JE, Nierman WC, Yu J, Archer DB, Bennett JW, Bhatnagar D, Cleveland TE, Fedorova ND, Gotoh O, Horikawa H, Hosoyama A, Ichinomiya M, Igarashi R, Iwashita K, Juvvadi PR, Kato M, Kato Y, Kin T, Kokubun A, Maeda H, Maeyama N, Maruyama J, Nagasaki H, Nakajima T, Oda K, Okada K, Paulsen I, Sakamoto K, Sawano T, Takahashi M, Takase K, Terabayashi Y, Wortman JR, Yamada O, Yamagata Y, Anazawa H, Hata Y, Koide Y, Komori T, Koyama Y, Minetoki T, Suharnan S, Tanaka A, Isono K, Kuhara S, Ogasawara N, Kikuchi H. Genome sequencing and analysis of Aspergillus oryzae. Nature. 2005;438:1157–1161. doi: 10.1038/nature04300. - DOI - PubMed

Publication types

Substances

LinkOut - more resources