. 2007 Oct 26;373(3):587-98.
doi: 10.1016/j.jmb.2007.07.066. Epub 2007 Aug 14.

The regulation of myosin binding to actin filaments by Lethocerus troponin

Affiliations

The regulation of myosin binding to actin filaments by Lethocerus troponin

Sabrina E Boussouf et al. J Mol Biol. .

Abstract

Lethocerus indirect flight muscle has two isoforms of troponin C, TnC-F1 and F2, which are unusual in having only a single C-terminal calcium binding site (site IV, isoform F1) or one C-terminal and one N-terminal site (sites IV and II, isoform F2). We show here that thin filaments assembled from rabbit actin and Lethocerus tropomyosin (Tm) and troponin (Tn) regulate the binding of rabbit myosin to rabbit actin in much the same way as the mammalian regulatory proteins. The removal of calcium reduces the rate constant for S1 binding to regulated actin about threefold, independent of which TmTn is used. This is consistent with calcium removal causing the TmTn to occupy the B or blocked state to about 70% of the total. The mid point pCa for the switch differed for TnC-F1 and F2 (pCa 6.9 and 6.0, respectively) consistent with the reported calcium affinities for the two TnCs. Equilibrium titration of S1 binding to regulated actin filaments confirms calcium regulated binding of S1 to actin and shows that in the absence of calcium the three actin filaments (TnC-F1, TnC-F2 and mammalian control) are almost indistinguishable in terms of occupancy of the B and C states of the filament. In the presence of calcium TnC-F2 is very similar to the control with approximately 80% of the filament in the C-state and 10-15% in the fully on M-State while TnC-F1 has almost 50% in each of the C and M states. This higher occupancy of the M-state for TnC-F1, which occurs above pCa 6.9, is consistent with this isoform being involved in the calcium activation of stretch activation. However, it leaves unanswered how a C-terminal calcium binding site of TnC can activate the thin filament.


Figures
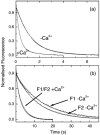
Figure 1
Figure 1
Influence of Lethocerus TmTn on the binding of rabbit S1 to actin. The fluorescence transients observed when 2.5 μM pyr-actin pre-incubated with 1 μM rabbit or Lethocerus TmTn complex was mixed with 0.25 μM rabbit S1. The best-fit single exponential fit is superimposed. (a) Control assay of rabbit S1 binding to rabbit actin with rabbit TmTn. The values of kobs were 3 s-1 and 0.85 s-1 for + and - Ca2+, respectively. (b) Assay for rabbit S1 binding to rabbit actin with Lethocerus TmTn containing TnC-F1 or F2. The values of kobs were 0.34 s-1 and 0.08 s-1 for F1 and 0.39 s-1 and 0.1 s-1 for F2 with and without Ca2+, respectively. Experimental conditions: 140 mM KCl, 5 mM MgCl2, 1 mM DTT, 20 mM Mops (pH 7.0) at 20 °C, with either 2 mM CaCl2 or 2 mM EGTA.
Figure 2
Figure 2
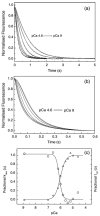
Dependence of the rate of S1 binding to pyr-actin. TmTn on calcium concentrations. (a) Observed transients for excess pyr-actin (2.5 μM and 1 μM skTmTn) binding to 0.25 μM S1. The best fit single exponentials (dotted line) are superimposed and gave kobs values of: 5.2 s-1 (pCa 4.6), 4.25 s-1 (pCa 5.6), 3.4 s-1 (pCa 6), 2.2 s-1 (pCa 6.2), 1.55 s-1 (pCa 6.6) and 1.2 s-1 (pCa 9). (b) Observed transients for excess S1 (2.5 μM) binding to 0.25 μM pyr-actin and 0.15 μM skeletal muscle TmTn. The same pCa values as for (a) were used. No fitted line was used. (c) Plot of kobs for S1 binding to excess pyr-actin (Δ, left axis, from (a)) and the t1/2 values for excess S1 binding to pyr-actin transients (circles, right axis, from (b)) plotted as a function of pCa. The data were fitted to a Hill equation and gave pCa50% values 6.02±0.02 and 6.09±0.05 and Hill coefficients (nCa) of 1.5±0.07, 2.8±0.15 for kobs and t1/2, respectively. Experimental conditions were as for Figure 1.
Figure 3
Figure 3
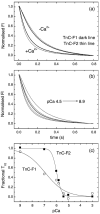
The calcium dependence of excess S1 binding to Lethocerus TmTn regulated thin filaments. The effect of calcium on the observed fluorescence transient when 2.5 μM S1 was rapidly mixed with 0.25 μM actin that had been pre-incubated with 0.2 μM Lethocerus TmTn. (a) The transients observed in the presence and absence of Ca2+ for Lethocerus TmTn with TnC-F1 or TnC-F2. (b) The calcium dependence of the observed transients for TnC-F1 over the pCa range 8.9 to 4.5. (c) A plot of the t1/2 time point against pCa for the two Lethocerus TnCs. The best fit to the Hill equation gives pK50% of 6.92±0.63 and 5.96±0.03 with nCa of 0.51±0.33 and 2.17±0.50 for TnC-F1 and F2, respectively.
Figure 4
Figure 4
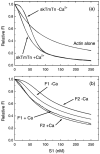
Fluorescence titration of pyr-actinTmTn with S1. The fluorescence changes observed when 50 nM pyr-actin pre-incubated with 1 μM TmTn was titrated with 0-250 nM rabbit S1 in the presence or absence of calcium. (a) Control titration using 50 nM pyr-actin with 0.3 μM rabbit TmTn (heavy line) with the best fit to the three-state model shown superimposed (thin line - barely visible on the fit). A titration using actin alone is also included with the best fit to a non-cooperative binding model Kd = 54 nM. (b) The titrations for Lethocerus TmTn (1 μM) with either the F1 or F2 form of TnC are shown (heavy line) with the best fit to the three-state model superimposed (thin line). The best-fit parameters to the three-state model are shown in Table 1.
Figure 5
Figure 5
The fractional occupancy of the three states of the TnC-F1 and TnC-F2 containing thin filaments as a function of calcium concentration. The occupancy at pCa 8.9 and pCa 4.5 are based on the values of KB and KT given in Table 1. (Calculated from fraction of actin as C states = 1/(1 + KT+1/KB), then B states = C states/KB and M states = C states KT). The values of KB at pCa 7 and 6 are based on the pCa plots of Figure 3(c) and were 0.37 and 1.4 for TnC-F1 and 1.03 and 9.5 for TnC-F2, respectively. KT was independent of calcium for TnC-F2 while for TnC-F1 it had a small dependence on calcium and was assumed to follow the same pCa dependence as KB with values of 0.55 at pCa 7 and 0.68 at pCa 6. Values for the rabbit TnC are not shown but were very similar to those for TnC-F2.
Figure 6
Figure 6
Lethocerus tropomyosin-TnT-TnH complex and TnC-F1 and F2. SDS-PAGE of samples: lane 1, IFM fraction applied to a butyl Sepharose column; lane 2, fraction from the column, containing pure TmTnTH; lane 3, F1 (TnC-F1); lane 4, F2 (TnC-F2); lane 5, markers. F1 and F2 were expressed in E. coli, and isolated from a cell lysate with Ni-agarose. An N-terminal 6His tag was removed with TEV protease. TnH is Lethocerus troponin I. αAc, α-actinin.

Similar articles

Cited by

References

    1. Pringle J. Stretch activation of muscle: function and mechanism. Proc. Roy. Soc. ser. B. 1978;201:107–130. - PubMed
    1. Josephson RK, Malamud JG, Stokes DR. Asynchronous muscle: a primer. J. Exp. Biol. 2000;203:2713–2722. - PubMed
    1. Esch H, Goller F, Heinrich B. How do bees shiver? Naturwissenschaften. 1991;78:325–328. - PubMed
    1. Heinrich B. The Thermal Warriors: Strategies of Insect Survival. Harvard University Press; Cambridge, MA: 1996.
    1. Kuhn HJ, Bletz C, Guth K, Ruegg JC. The effect of MgATP on forming and breaking actin-myosin linkages in contracted skinned insect flight muscle fibres. J. Mus. Res. Cell Motil. 1985;6:5–27. - PubMed

Publication types

LinkOut - more resources