Comparative Study
. 2007 Oct 26;373(3):755-63.
doi: 10.1016/j.jmb.2007.08.043. Epub 2007 Aug 24.

Structural and kinetic characterization of quinolinate phosphoribosyltransferase (hQPRTase) from homo sapiens

Affiliations
Comparative Study

Structural and kinetic characterization of quinolinate phosphoribosyltransferase (hQPRTase) from homo sapiens

Huanting Liu et al. J Mol Biol. .

Abstract

Human quinolinate phosphoribosyltransferase (EC 2.4.2.19) (hQPRTase) is a member of the type II phosphoribosyltransferase family involved in the catabolism of quinolinic acid (QA). It catalyses the formation of nicotinic acid mononucleotide from quinolinic acid, which involves a phosphoribosyl transfer reaction followed by decarboxylation. hQPRTase has been implicated in a number of neurological conditions and in order to study it further, we have carried out structural and kinetic studies on recombinant hQPRTase. The structure of the fully active enzyme overexpressed in Escherichia coli was solved using multiwavelength methods to a resolution of 2.0 A. hQPRTase has a alpha/beta barrel fold sharing a similar overall structure with the bacterial QPRTases. The active site of hQPRTase is located at an alpha/beta open sandwich structure that serves as a cup for the alpha/beta barrel of the adjacent subunit with a QA binding site consisting of three arginine residues (R102, R138 and R161) and two lysine residues (K139 and K171). Mutation of these residues affected substrate binding or abolished the enzymatic activity. The kinetics of the human enzyme are different to the bacterial enzymes studied, hQPRTase is inhibited competitively and non-competitively by one of its substrates, 5-phosphoribosylpyrophosphate (PRPP). The human enzyme adopts a hexameric arrangement, which places the active sites in close proximity to each other.


Figures

Figure 1
Figure 1
Schematic representation of the quinolinic acid biosynthetic pathway.
Figure 2
Figure 2
The structure of hQPRTase. A) The hQPRTase monomer. The helices are shown in red, beta sheets are in yellow and loops are in blue. B) The hQPRTase dimer which is also found in bacterial enzymes. Monomer A is shown in green while monomer B is colored cyan. Tartaric acid is shown as sticks (oxygen colored red and carbon colored yellow) and locates the active site. C) Ribbon diagram of the hQPRTase hexamer in the asymmetric unit, monomers A and B are colored as (b), monomers C, D, E and F are colored deep red, salmon, yellow and orange respectively. The three fold axis is perpendicular to the plane of the paper, the three two folds lie in the plane giving the hexamer D3 symmetry. D) Superposition of hQPRTase and the Mt-QPRTase QA complex (PDB 1QPQ) active sites. Atoms are colored as 2b, except Mt-QPRTase carbons are shown in light grey. The key conserved residues are shown, as are QA and tartaric acid. The residues that form the active site come from both monomers in the dimer, to show this in hQPRTase the Cα atoms are colored green (monomer A) and cyan (monomer B). In Mt-QPRTase, Cα is colored purple in monomer A and orange in monomer B.
Figure 2
Figure 2
The structure of hQPRTase. A) The hQPRTase monomer. The helices are shown in red, beta sheets are in yellow and loops are in blue. B) The hQPRTase dimer which is also found in bacterial enzymes. Monomer A is shown in green while monomer B is colored cyan. Tartaric acid is shown as sticks (oxygen colored red and carbon colored yellow) and locates the active site. C) Ribbon diagram of the hQPRTase hexamer in the asymmetric unit, monomers A and B are colored as (b), monomers C, D, E and F are colored deep red, salmon, yellow and orange respectively. The three fold axis is perpendicular to the plane of the paper, the three two folds lie in the plane giving the hexamer D3 symmetry. D) Superposition of hQPRTase and the Mt-QPRTase QA complex (PDB 1QPQ) active sites. Atoms are colored as 2b, except Mt-QPRTase carbons are shown in light grey. The key conserved residues are shown, as are QA and tartaric acid. The residues that form the active site come from both monomers in the dimer, to show this in hQPRTase the Cα atoms are colored green (monomer A) and cyan (monomer B). In Mt-QPRTase, Cα is colored purple in monomer A and orange in monomer B.
Figure 3
Figure 3
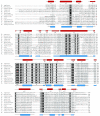
Sequence alignment of the hQPRTase homologs. Conserved residues are highlighted in black and mutagenesis analyzed residues are marked with asterisks. The secondary structure elements of hQPRTase are shown above the alignment while those of Mt-QPRTase are shown below; Helices are represented as rectangles and strands as arrows. The aligned sequences and their access numbers are, Homo sapiens (Q15274), Mus musculus (Q91X91), Saccharomyces cerevisiae (NP 602317), Nicotiana tabacum (BAA92153), Nicotiana rustica (CAB59429), Thermotoga maritime (1O4U). Helicobacter pylori (2B7Q), Thermus thermophilus (1X1O), Escherichia coli (AAB00467), Erwinia carotovora (CAG76696), Salmonella typhimurium (1QAP), Streptomyces coelicolor (NP 627589) and Mycobacterium tuberculosis (1QPQ). Sequences were aligned using the program BioEdit version 4.8.10.
Figure 4
Figure 4
Effect of PRPP and QA concentration on the rate of formation of NAMN catalyzed by purified hQPRTase. A) Lineweaver-burk plots for QA as the variable substrate at a range of fixed PRPP concentrations. Reaction mixtures with a total volume of 1 ml contained 50 mM K2HPO4/KH2PO4, pH 7.2, 6 mM MgCl2, QA and PRPP concentrations as described. B) Lineweaver-burk plots for PRPP as the variable substrate at a range of fixed QA concentrations. Reaction mixtures with a total volume of 1ml contained 50 mM K2HPO4/KH2PO4, pH 7.2, 6 mM MgCl2, 0.1 mM PRPP and the concentration of QA as described. C) Lineweaver-burk plot for PRPP as the variable substrate over an extended concentration range (0.01 to 5.0 mM). Inhibition is mixed. Reaction mixtures with a total volume of 1ml contained 50 mM K2HPO4/KH2PO4, pH 7.2, 6 mM MgCl2, 0.3 mM QA and the concentration of PRPP as described in the text.
Figure 4
Figure 4
Effect of PRPP and QA concentration on the rate of formation of NAMN catalyzed by purified hQPRTase. A) Lineweaver-burk plots for QA as the variable substrate at a range of fixed PRPP concentrations. Reaction mixtures with a total volume of 1 ml contained 50 mM K2HPO4/KH2PO4, pH 7.2, 6 mM MgCl2, QA and PRPP concentrations as described. B) Lineweaver-burk plots for PRPP as the variable substrate at a range of fixed QA concentrations. Reaction mixtures with a total volume of 1ml contained 50 mM K2HPO4/KH2PO4, pH 7.2, 6 mM MgCl2, 0.1 mM PRPP and the concentration of QA as described. C) Lineweaver-burk plot for PRPP as the variable substrate over an extended concentration range (0.01 to 5.0 mM). Inhibition is mixed. Reaction mixtures with a total volume of 1ml contained 50 mM K2HPO4/KH2PO4, pH 7.2, 6 mM MgCl2, 0.3 mM QA and the concentration of PRPP as described in the text.

Similar articles

Cited by

References

    1. Iwai K, Taguchi H. Distribution of quinolinate phosphoribosyl-transferase in animals, plants and microorganisms. J Nutr Sci Vitaminol (Tokyo) 1973;19:491–9. - PubMed
    1. Foster AC, Whetsell WO, Jr., Bird ED, Schwarcz R. Quinolinic acid phosphoribosyltransferase in human and rat brain: activity in Huntington’s disease and in quinolinate-lesioned rat striatum. Brain Res. 1985;336:207–14. - PubMed
    1. Feldblum S, Rougier A, Loiseau H, Loiseau P, Cohadon F, Morselli PL, Lloyd KG. Quinolinic-phosphoribosyl transferase activity is decreased in epileptic human brain tissue. Epilepsia. 1988;29:523–9. - PubMed
    1. Foster AC, Schwarcz R. Characterization of quinolinic acid phosphoribosyltransferase in human blood and observations in Huntington’s disease. J Neurochem. 1985;45:199–205. - PubMed
    1. Speciale C, Okuno E, Schwarcz R. Increased quinolinic acid metabolism following neuronal degeneration in the rat hippocampus. Brain Res. 1987;436:18–24. - PubMed

Publication types

Substances