. 2008 Feb;45(3):839-48.
doi: 10.1016/j.molimm.2006.11.026. Epub 2007 Sep 14.

Functional analysis of the host defense peptide Human Beta Defensin-1: new insight into its potential role in cancer

Affiliations

Functional analysis of the host defense peptide Human Beta Defensin-1: new insight into its potential role in cancer

Rebecca S Bullard et al. Mol Immunol. 2008 Feb.

Abstract

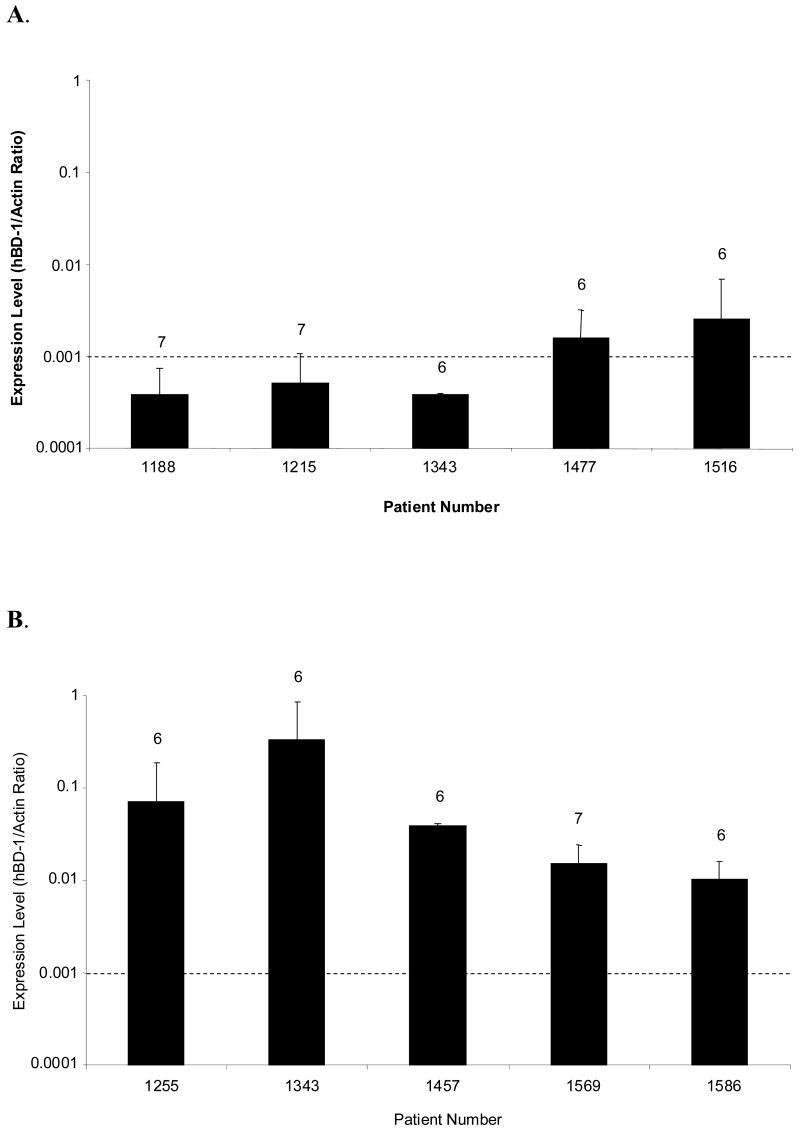
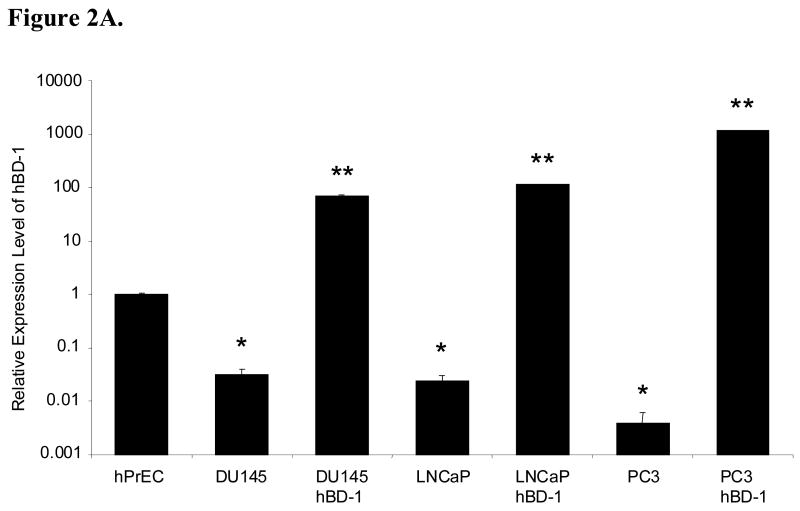
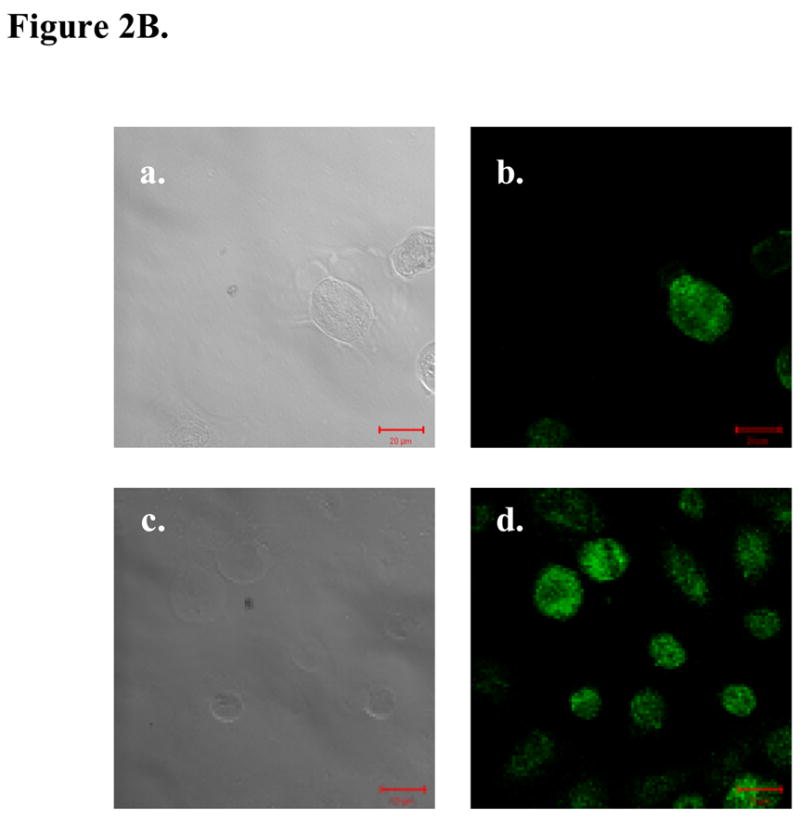
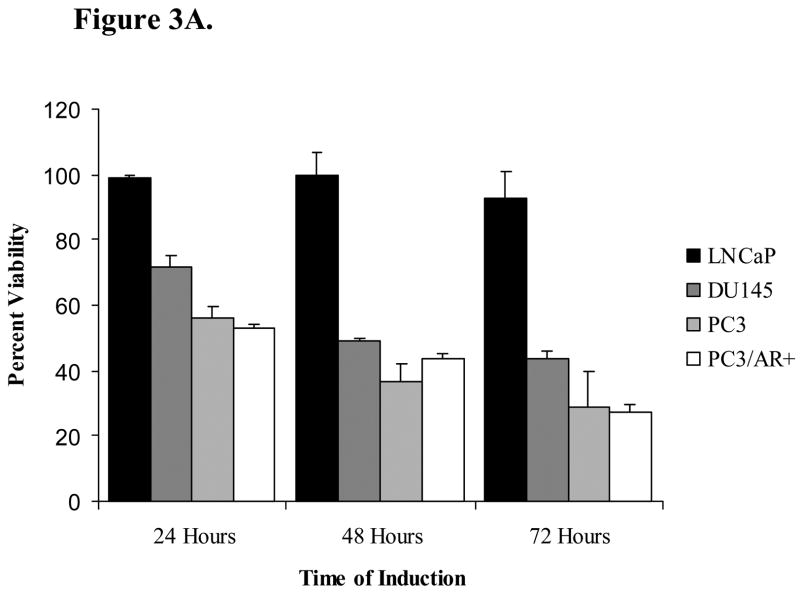
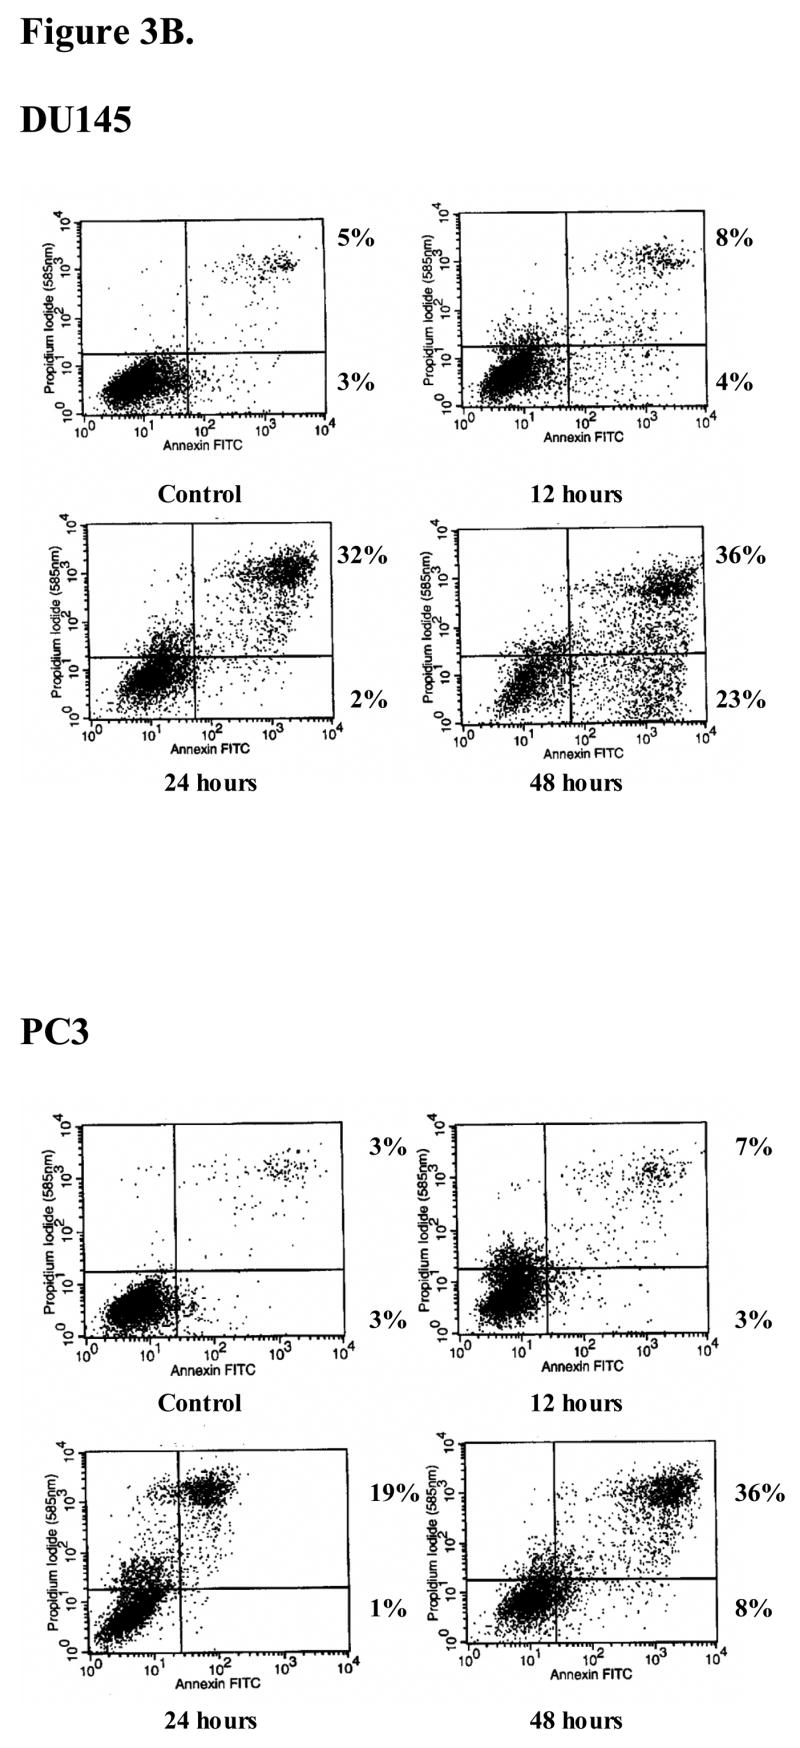
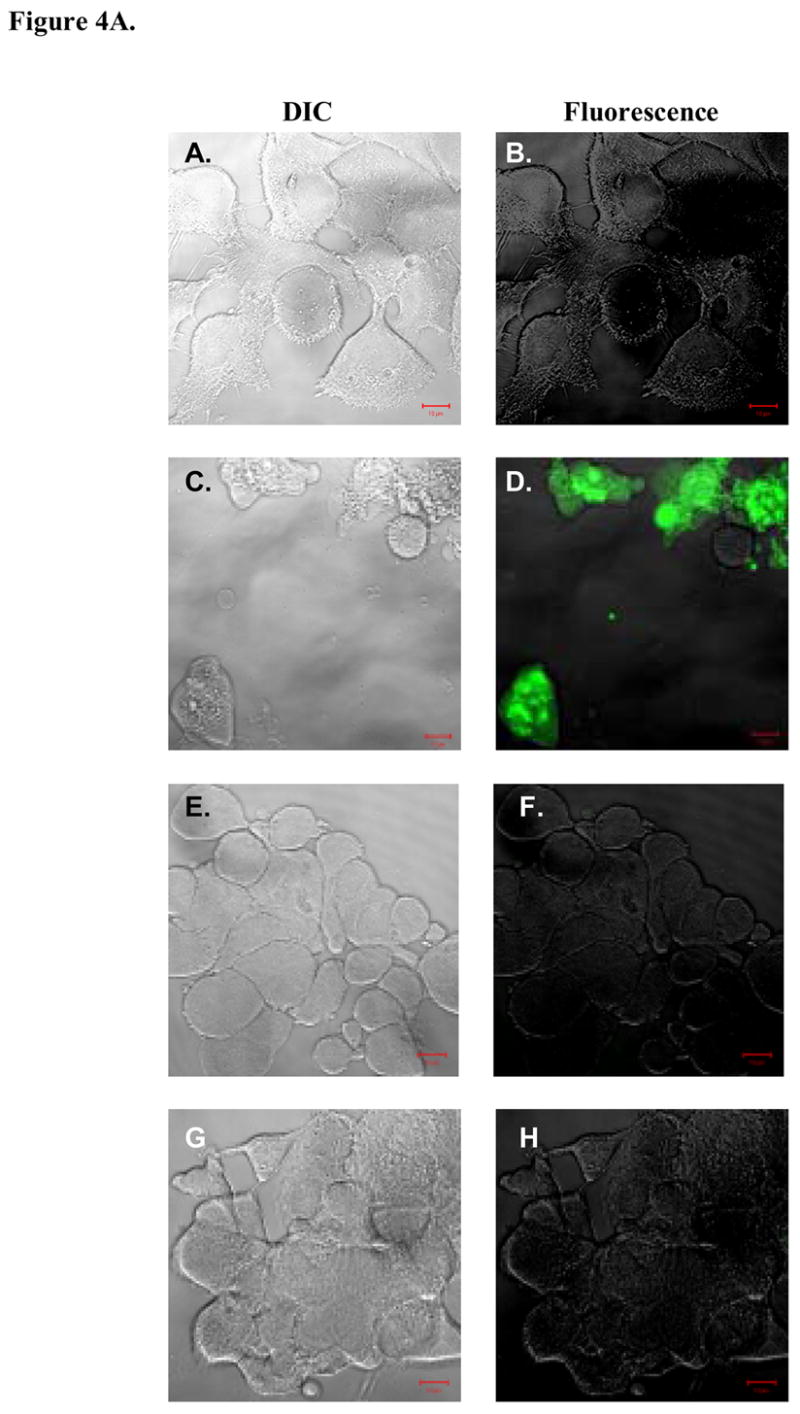
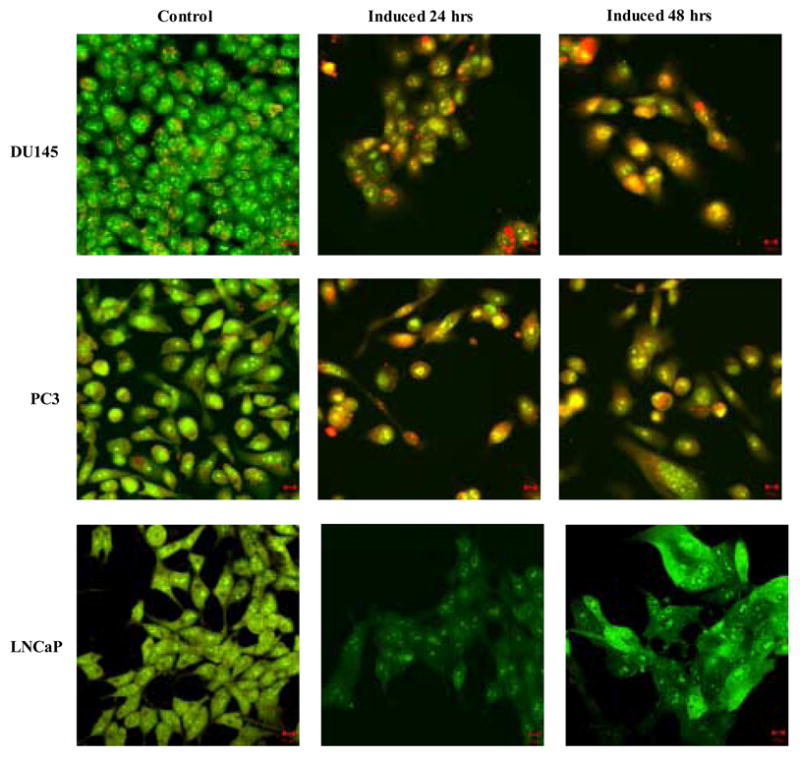
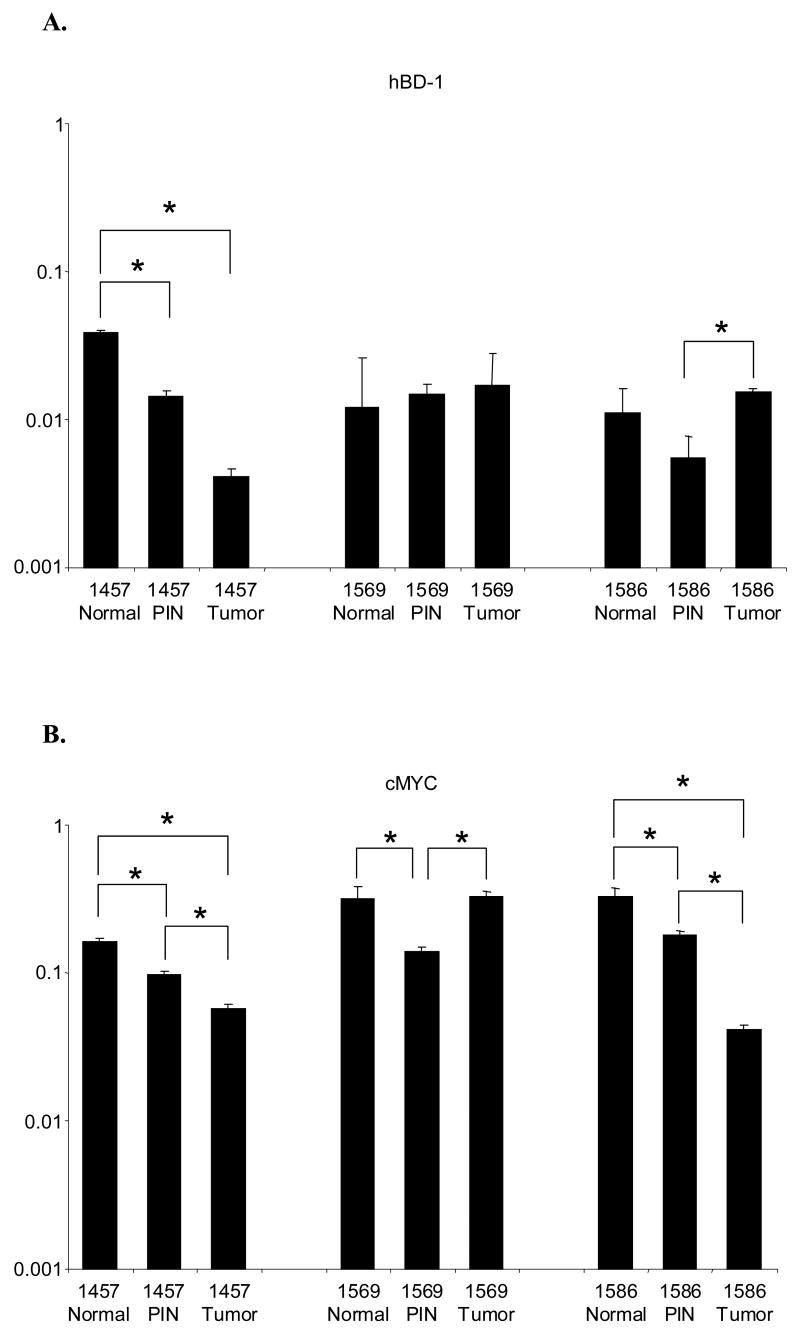
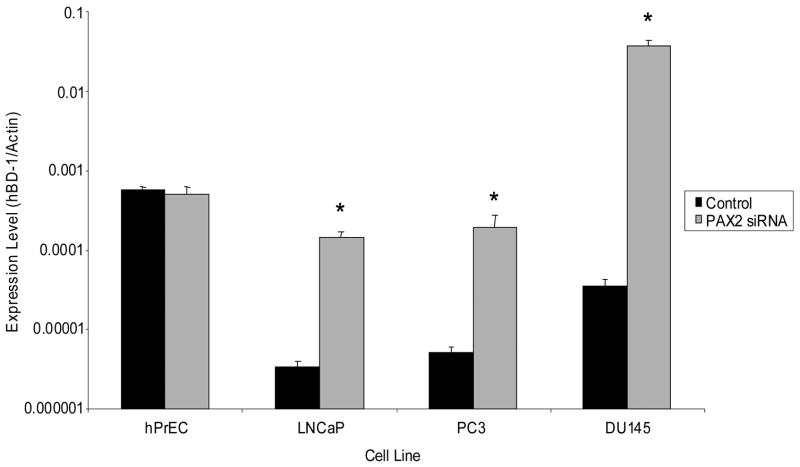
Although it is known that innate immunity is key for protecting the body against foreign agents such as bacteria, little is known about elements of the innate immune system that have anti-tumor activity. Human Beta Defensin-1 (hBD-1), an important component of the innate immune response, is lost at high frequencies in malignant prostatic tissue, while high levels of expression are maintained in adjacent benign regions. In prostate carcinoma, frequent genetic alterations occur in the 8p22-23 region and several studies indicate there may be multiple tumor suppressor genes present within this region. The high incidence of loss of hBD-1 expression in prostate cancer, along with its chromosomal location of 8p23.2, raised the possibility that it may play a role in tumor suppression. To gain insight as to its function in prostate cancer, hBD-1 was cloned and ectopically expressed in four prostate cancer cell lines. Induction of hBD-1 expression resulted in a decrease in cellular growth in DU145 and PC3 cells. However, hBD-1 has no effect on the growth of androgen receptor (AR) positive LNCaP prostate cancer cells, but was again growth suppressive to PC3 cells with ectopic AR expression (PC3/AR+). hBD-1 also caused rapid induction of cytolysis and caspase-mediated apoptosis in DU145 and PC3 prostate cancer cells. Although the regulation of hBD-1 was not addressed in this study, our preliminary data demonstrated that the pathways involved may include cMYC and PAX2. Data presented here are the first to provide evidence of its potential role in prostate cancer cell death.


Figures

Figure 1
Figure 1. Analysis of hBD-1 Expression in Human Prostate Tissue
hBD-1 relative expression levels were compared in normal clinical samples from patients that underwent radical prostatectomies. The dashed line serves as a point of reference to compare values obtained between gross and LCM-derived specimen, and corresponding Gleason scores are indicated above each bar. A, hBD-1 expression levels were compared in tissues obtained by gross dissection. B, hBD-1 expression levels were compared in tissue obtained by Laser Capture Microdissection.
Figure 2
Figure 2. Analysis of hBD-1 Expression in Prostate Cell Lines
A, hBD-1 expression levels were compared relative to hPrEC cells in prostate cancer cell lines before and after hBD-1 induction. A single asterisk represents statistically lower expression levels compared to hPrEC. Double asterisks represent statistically significant levels of expression compared to the cell line before hBD-1 induction (Student’s T-test, p<0.05). B, Ectopic hBD-1 expression was verified in the prostate cancer cell line DU145 by immunocytochemistry. hPrEC cells were stained for hBD-1 as a positive control (A: DIC and B: Fluorescence). DU145 cells were transfected with hBD-1 and induced for 18 hours (C: DIC and D: Fluorescence). Size bar= 20 μM.
Figure 3
Figure 3. Analysis of hBD-1 Cytotoxicity in Prostate Cancer Cells
A, the prostate cell lines DU145, PC3, PC3/AR+ and LNCaP were treated with Pon A to induce hBD-1 expression for 1–3 days after which MTT assay was performed to determine cell viability. Each bar represents the mean ± S.E.M. of three independent experiments performed in triplicate. B, cells positive for propidium iodide and annexin V were considered apoptotic. Times of induction are shown under each panel. Numbers next to the boxes for each time point represent the percentages of propidium iodide (PI) annexin V+ cells (lower right quadrant), and PI+ annexin V+ cells (upper right quadrant).
Figure 4
Figure 4. Analysis of hBD-1 mediated cell death
A, DIC visualization of DU145 cells before (A) and after (C) hBD-1 induction, and LNCaP cells before (E) and after (G) induction. Fluorescence analysis revealed no caspase activity in control DU145 (B) and LNCaP (F) cells. However, cells treated with Pon A for 24 hours to induce hBD-1 revealed caspase activity in DU145 (D), but not in LNCaP (H). B, membrane integrity of DU145, PC3 and LNCaP was analyzed by confocal microscopy 24 and 48 hours after hBD-1 induction. Green staining indicates the localization of AO, red staining represents EtBr and yellow staining represents the co-localization of both AO and EtBr. Size bars= 10 μM.
Figure 5
Figure 5. QRT-PCR analysis of hBD-1 and cMYC expression in LCM human prostate tissue sections of normal, PIN and tumor
Expression for each gene is presented as expression ratios compared to β-actin. A, Comparison of hBD-1 expression levels in normal, PIN and tumor sections. B, Comparison of cMYC expression level in normal, PIN and tumor sections.
Figure 6
Figure 6. QRT-PCR analysis of hBD1 expression following PAX2 knockdown with siRNA
hBD-1 expression levels are presented as expression ratios compared to β-actin. A single asterisk represents statistically lower expression levels compared to the cell line before PAX2 siRNA treatment (Student’s T-test, p<0.05).

References

    1. Braida L, Boniotto M, Pontillo A, Tovo PA, Amoroso A, Crovella S. A single-nucleotide polymorphism in the human beta-defensin 1 gene is associated with HIV-1 infection in Italian children. Aids. 2004;18:1598–600. - PubMed
    1. Discenza MT, He S, Lee TH, Chu LL, Bolon B, Goodyer P, Eccles MR, Pelletier J. WT1 is a modifier of the Pax2 mutant phenotype: cooperation and interaction between WT1 and Pax2. Oncogene. 2003;22(50):8145–55. - PubMed
    1. Donald CD, Sun CQ, Lim SD, Macoska J, Cohen C, Amin MB, Young AN, Ganz TA, Marshall FF, Petros JA. Cancer-specific loss of beta-defensin 1 in renal and prostatic carcinomas. Lab Invest. 2003;83:501–5. - PubMed
    1. Eccles MR, HE S, Legge M, Kumar R, Fox J, Zhou C, French M, Tsai RW. PAX genes in development and disease: the role of PAX2 in urogenital tract development. Int J Dev Biol. 2002;46(4):535–44. - PubMed
    1. Ganz T. Defensins and host defense. Science. 1999;286:420–1. - PubMed

Publication types

MeSH terms