The thyroid hormone receptor-alpha (TRalpha) gene encoding TRalpha1 controls deoxyribonucleic acid damage-induced tissue repair
- PMID: 17872380
- PMCID: PMC5419624
- DOI: 10.1210/me.2007-0278
The thyroid hormone receptor-alpha (TRalpha) gene encoding TRalpha1 controls deoxyribonucleic acid damage-induced tissue repair
Abstract
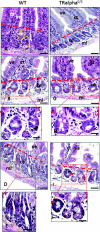
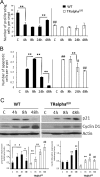
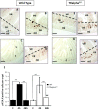
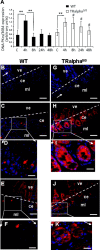
The thyroid hormone (TH) controls, via its nuclear receptor, TH receptor-alpha1 (TRalpha1), intestinal crypt cell proliferation in the mouse. In order to understand whether this receptor also plays a role in intestinal regeneration after DNA damage, we applied a protocol of gamma-ray irradiation and monitored cell proliferation and apoptosis at several time points. In wild-type mice, the dose of 8 Gy induced cell cycle arrest and apoptosis in intestinal crypts a few hours after irradiation. This phenomenon reverted 48 h after irradiation. TRalpha(0/0) mutant mice displayed a constant low level of proliferating cells and a high apoptosis rate during the period of study. At the molecular level, in TRalpha(0/0) animals we observed a delay in the p53 phosphorylation induced by DNA damage. In our search for the expression of the protein kinases responsible for p53 phosphorylation upon irradiation, we have focused on DNA-dependent protein kinase catalytic subunit (DNA-PKcs). The number of cells expressing DNA-PKcs in crypts remained high 48 h after irradiation, specifically in TRalpha mutants. Altogether, in TRalpha(0/0) animals the rate of apoptosis in crypt cells remained high, apparently due to an elevated number of cells still presenting DNA damage. In conclusion, the TRalpha gene plays a role in crypt cell homeostasis by regulating the rate of cell renewal and apoptosis induced by DNA damage.
Figures


Similar articles
-
Thyroid hormone limits postnatal Sertoli cell proliferation in vivo by activation of its alpha1 isoform receptor (TRalpha1) present in these cells and by regulation of Cdk4/JunD/c-myc mRNA levels in mice.Biol Reprod. 2012 Jul 19;87(1):16, 1-9. doi: 10.1095/biolreprod.111.098418. Print 2012 Jul. Biol Reprod. 2012. PMID: 22539677
-
Analysis of Thyroid Hormone Receptor α-Knockout Tadpoles Reveals That the Activation of Cell Cycle Program Is Involved in Thyroid Hormone-Induced Larval Epithelial Cell Death and Adult Intestinal Stem Cell Development During Xenopus tropicalis Metamorphosis.Thyroid. 2021 Jan;31(1):128-142. doi: 10.1089/thy.2020.0022. Epub 2020 Jul 1. Thyroid. 2021. PMID: 32515287 Free PMC article.
-
Radiation-induced p53 and p21WAF-1/CIP1 expression in the murine intestinal epithelium: apoptosis and cell cycle arrest.Am J Pathol. 1998 Sep;153(3):899-909. doi: 10.1016/S0002-9440(10)65631-3. Am J Pathol. 1998. PMID: 9736038 Free PMC article.
-
Impaired oxidative endoplasmic reticulum stress response caused by deficiency of thyroid hormone receptor α.J Biol Chem. 2014 May 2;289(18):12485-93. doi: 10.1074/jbc.M113.544122. Epub 2014 Mar 18. J Biol Chem. 2014. PMID: 24644288 Free PMC article.
-
[Analysis of the role of DNA repair, regulation of cell cycle and apoptosis in the radiation-induced adaptive response of mammalian cells].Radiats Biol Radioecol. 2003 Jan-Feb;43(1):19-28. Radiats Biol Radioecol. 2003. PMID: 12677654 Review. Russian.
Cited by
-
New insights into the role of thyroid hormone in cardiac remodeling: time to reconsider?Heart Fail Rev. 2011 Jan;16(1):79-96. doi: 10.1007/s10741-010-9185-3. Heart Fail Rev. 2011. PMID: 20668933 Review.
-
Thyroid Hormone Nuclear Receptor TRα1 and Canonical WNT Pathway Cross-Regulation in Normal Intestine and Cancer.Front Endocrinol (Lausanne). 2021 Dec 10;12:725708. doi: 10.3389/fendo.2021.725708. eCollection 2021. Front Endocrinol (Lausanne). 2021. PMID: 34956074 Free PMC article.
-
Thyroid hormone and tissue repair: new tricks for an old hormone?J Thyroid Res. 2013;2013:312104. doi: 10.1155/2013/312104. Epub 2013 Feb 25. J Thyroid Res. 2013. PMID: 23533950 Free PMC article.
-
Molecular Functions of Thyroid Hormone Signaling in Regulation of Cancer Progression and Anti-Apoptosis.Int J Mol Sci. 2019 Oct 9;20(20):4986. doi: 10.3390/ijms20204986. Int J Mol Sci. 2019. PMID: 31600974 Free PMC article. Review.
-
Thyroid hormone signaling in the intestinal stem cells and their niche.Cell Mol Life Sci. 2022 Aug 10;79(9):476. doi: 10.1007/s00018-022-04503-y. Cell Mol Life Sci. 2022. PMID: 35947210 Free PMC article. Review.
References
-
- Brent GA 2000. Tissue-specific actions of thyroid hormone: insights from animal models. Rev Endocr Metab Disord 1:27–33 - PubMed
-
- Flamant F, Gauthier K, Samarut J 2007. Thyroid hormones signaling is getting more complex: STORMs are coming. Mol Endocrinol 21:321–333 - PubMed
-
- Plateroti M, Kress E, Samarut J 2007. Specific actions of thyroid hormones during gut development: insights from animal models. J Pediatr Endocrinol Metab 20:119–122
-
- Shi YB, Wong J, Puzianowska-Kuznicka M, Stolow MA 1996. Tadpole competence and tissue-specific temporal regulation of amphibian metamorphosis: roles of thyroid hormone and its receptors. Bioessays 18:391–399 - PubMed
Publication types
MeSH terms
Substances
LinkOut - more resources
Full Text Sources
Molecular Biology Databases
Research Materials
Miscellaneous

