. 2008 Jan 15;94(2):349-58.
doi: 10.1529/biophysj.107.113340. Epub 2007 Sep 14.

Approximate analytical time-dependent solutions to describe large-amplitude local calcium transients in the presence of buffers

Affiliations

Approximate analytical time-dependent solutions to describe large-amplitude local calcium transients in the presence of buffers

Lidia A Mironova et al. Biophys J. .

Abstract

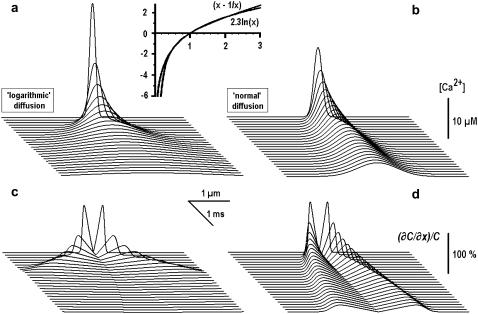
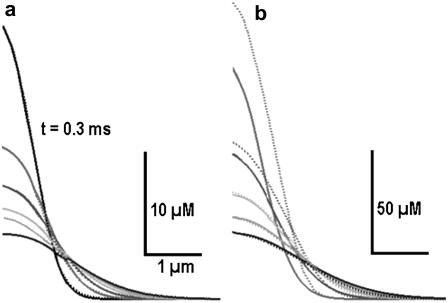
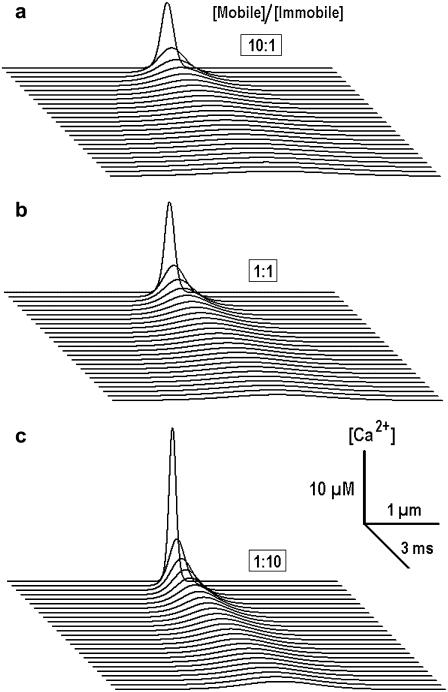
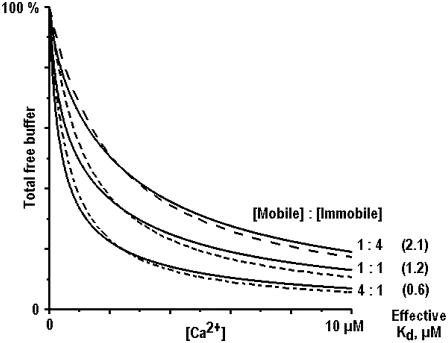
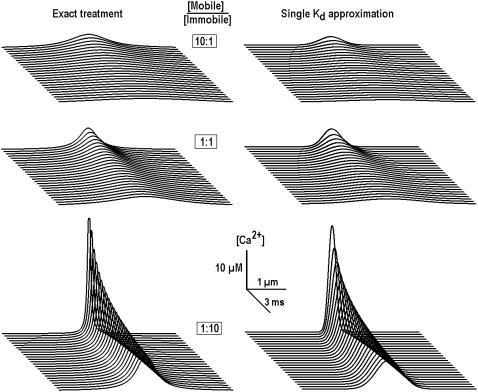
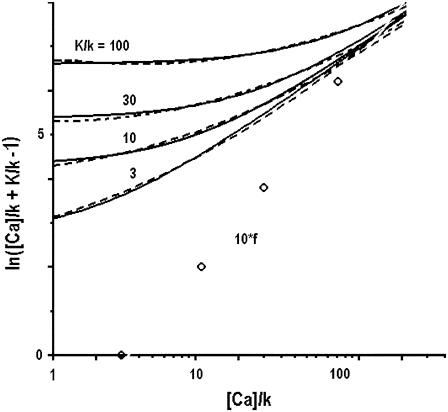
Local Ca(2+) signaling controls many neuronal functions, which is often achieved through spatial localization of Ca(2+) signals. These nanodomains are formed due to combined effects of Ca(2+) diffusion and binding to the cytoplasmic buffers. In this article we derived simple analytical expressions to describe Ca(2+) diffusion in the presence of mobile and immobile buffers. A nonlinear character of the reaction-diffusion problem was circumvented by introducing a logarithmic approximation of the concentration term. The obtained formulas reproduce free Ca(2+) levels up to 50 microM and their changes in the millisecond range. Derived equations can be useful to predict spatiotemporal profiles of large-amplitude [Ca(2+)] transients, which participate in various physiological processes.


Figures

FIGURE 1
FIGURE 1
“Logarithmic” and “normal” diffusion of Ca2+ from the point source. Shown are the time-dependent profiles of Ca2+ concentration, which were obtained from Eqs. 8 and 7, describing the fast (a) and the normal (b) diffusion, respectively. In both cases, the effective diffusion coefficient was 40 μm2/s and the same amplitude of point source was used. The inset (top) shows the approximation of “total [Ca2+]” term in Eqs. 4 and 5 by logarithm. Panels a and b depict [Ca2+] changes, and panels c and d present normalized spatial derivatives as indicators of the fronts of Ca2+ concentration.
FIGURE 2
FIGURE 2
Exact Ca2+ transients and their approximation. Time-dependent Ca2+ concentration profiles obtained by numerical integration of reaction-diffusion system using the Crank-Nicolson algorithm (dotted curves) are approximated by the analytical solution for the logarithmic diffusion (solid curves). The diffusion coefficients were DCa = 200 μm2/s, dBuffer = 20 μm2/s, the on- and off-rate constants were kon = 108 M−1s−1 and koff = 100 s−1 (Kd = 1 μM), and the total buffer concentration Bo = 1 mM. For the logarithmic diffusion the apparent diffusion coefficient Δ was 40 μm2/s. In panel b the amplitude of instantaneous Ca2+ source was seven times bigger than in panel a. Note a close correspondence between the two solutions (a) and underestimation of the large amplitude transients in the case of the logarithmic diffusion (b).
FIGURE 3
FIGURE 3
Ca2+ transients in the presence of mobile and immobile buffers of the same affinity. Calculations were performed at fixed total buffer concentration (1 mM) and the mol fraction of buffers was varied as indicated in each panel. The diffusion coefficient of mobile buffer was 20 μm2/s and the dissociation constant for both buffers was set to 0.3 μM. In the calculations, we used the effective diffusion coefficient, which depended on the [Mobile]/[Immobile] ratio; see Eq. 10. Note a sharpening of Ca2+ transients with the increase in the mol fraction of the immobile buffer.
FIGURE 4
FIGURE 4
Effective dissociation constants in mixtures of mobile and immobile Ca2+ buffers. Solid traces indicate the Ca2+ binding capacity in the presence of two buffers with dissociation constants equal to 0.3 and 3 μM (see Appendix III). The dotted curves approximate the data by assuming the same dissociation constant for both buffers. Its values are given in parentheses (right of the curves) and depend on the mol ratio.
FIGURE 5
FIGURE 5
Ca2+ transients in the presence of mobile and immobile Ca2+ buffers of different affinity. The panels show Ca2+ transients at different buffer mol ratios as indicated. The total buffer concentration was 1 mM, the dissociation constants of the mobile and the immobile buffers were 0.3 μM and 3 μM, respectively, and the diffusion coefficient for the mobile buffer was 20 μm2/s. The profiles in the left column were obtained by explicitly considering the effects of two buffers (Eq. 14). The profiles in the right column show the transients calculated by using effective dissociation constants (Fig. 4) and diffusion coefficients (Eq. 10), which both depended on the mol ratio. Note a close correspondence between the transients in the two sets of data.
FIGURE 6
FIGURE 6
Calculations of the velocity of Ca2+ waves due to regenerative Ca2+ release from internal stores. The velocities were obtained as the ratios of distances between the release sites and the times needed for a [Ca2+] transient to reach the threshold of release at the neighboring site. In panel a the threshold was set to 0.2 μM and the distance between the release sites was varied. In panel b the distance between the release sites was fixed at 1 μm and the threshold was varied. The parameters of intrinsic cytoplasmic buffer were Bo = 1 mM, Kd = 1 μM, and d = 20 μm2/s (mobile buffer). Middle curves in each panel correspond to the case when the concentrations of the mobile and immobile buffers were equal.
FIGURE 7
FIGURE 7
Local [Ca2+] transients in the presence of “slow” (EGTA) and “fast” (BAPTA) buffers. Spatiotemporal profiles of free and bound Ca2+ were obtained by using Eq. 8 for the fast diffusion. The concentration of intrinsic buffer was 0.1 mM, Kd = 1 μM, and the diffusion coefficient was 20 μm2/s. Same Kd and d values were assumed for EGTA and BAPTA (both present at 10 mM). In the case of EGTA we considered the Ca2+ binding only to its high-affinity form (1% of total at physiological pH or 0.1 mM; see “Rapid and slow Ca2+ buffers”).
FIGURE 8
FIGURE 8
Approximation of logarithm ln(y + γ) in Eq. B1 by quadratic polynomial A lny2 + B lny + C. Solid lines show the original functions and the dotted lines indicate their approximations. In all fits, the coefficient A = 0.07 and the coefficients B were obtained from the empirical function f = 1.8 ln(Kn/k) − 4.2 (multiplied in plot by 10 to fit the scale).
FIGURE 9
FIGURE 9
Binding capacity of cytoplasmic Ca2+ buffers and its approximation. The graphs are based on the representative literature data listed in Table 1. The amount of bound Ca2+ in the mixtures of mobile and immobile Ca2+ buffers is shown by continuous lines as indicated. The traces are approximated by considering only one buffer with the effective dissociation constants indicated near each curve.

References

    1. Augustine, G. J., F. Santamaria, and K. Tanaka. 2003. Local calcium signaling in neurons. Neuron. 40:331–346. - PubMed
    1. Roussel, C. J., and M. R. Roussel. 2004. Reaction-diffusion models of development with state-dependent chemical diffusion coefficients. Prog. Biophys. Mol. Biol. 86:113–160. - PubMed
    1. Ward, M. J. 2006. Asymptotic methods for reaction-diffusion systems: past and present. Bull. Math. Biol. 68:1151–1167. - PubMed
    1. Neher, E. 1986. Concentration profiles of intracellular Ca2+ in the presence of diffusible chelator. Exp. Brain Res. 14:80–96.
    1. Sherman, A., G. D. Smith, L. Dai, and R. M. Miura. 2001. Asymptotic analysis of buffered calcium diffusion near a point source. SIAM J. Appl. Math. 61:1816–1831.

LinkOut - more resources