. 2008 Jan 15;94(2):532-41.
doi: 10.1529/biophysj.106.097881. Epub 2007 Sep 14.

Transport of beads by several kinesin motors

Affiliations

Transport of beads by several kinesin motors

Janina Beeg et al. Biophys J. .

Abstract

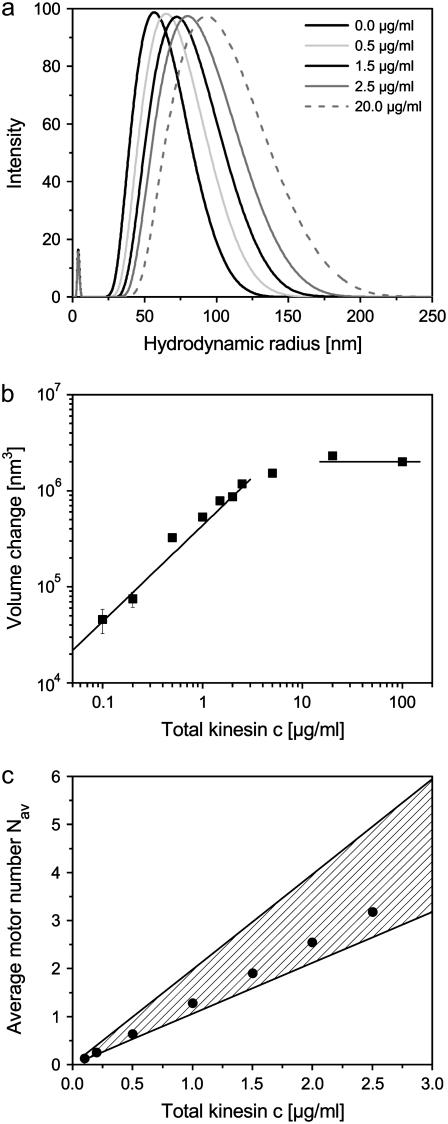
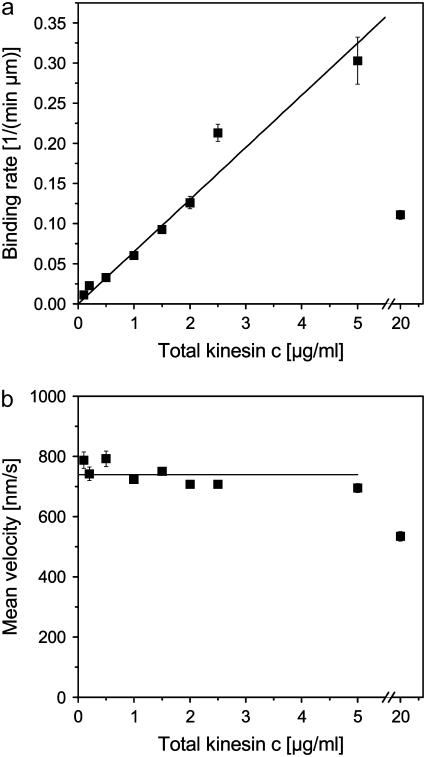
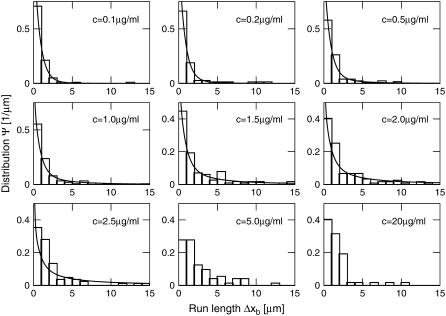
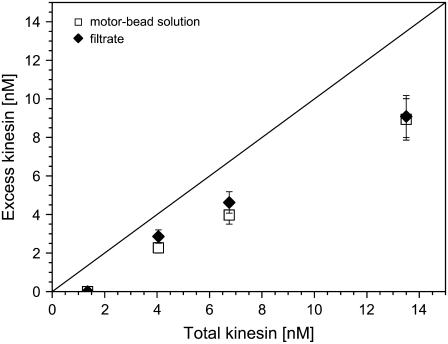
The movements of beads pulled by several kinesin-1 (conventional kinesin) motors are studied both theoretically and experimentally. While the velocity is approximately independent of the number of motors pulling the beads, the walking distance or run-length is strongly increased when more motors are involved. Run-length distributions are measured for a wide range of motor concentrations and matched to theoretically calculated distributions using only two global fit parameters. In this way, the maximal number of motors pulling the beads is estimated to vary between two and seven motors for total kinesin concentrations between 0.1 and 2.5 microg/ml or between 0.27 and 6.7 nM. In the same concentration regime, the average number of pulling motors is found to lie between 1.1 and 3.2 motors.


Figures

FIGURE 1
FIGURE 1
(a) Size distribution of kinesin-coated beads as obtained from dynamic light scattering (DLS) for different kinesin concentrations. (b) Increase of the effective bead volume (as compared to beads without kinesin) as a function of the kinesin concentration. The lines indicate the linear and the saturated regime. (c) Average number of motors involved in the transport of the beads. The shaded region shows the range of motor numbers as estimated from the DLS data (see text), the black dots represent values obtained from fitting the theoretical run-length distributions to the experimental histograms shown in Fig. 3 below.
FIGURE 2
FIGURE 2
(a) Binding rate as defined by the number of beads binding to a microtubule per-μm microtubule length and per-minute and (b) average bead velocity as functions of the kinesin concentration c in the solution from which the motors were bound to the beads. The measured binding rates are fitted by a linear relation and the velocities by a constant for concentrations up to 5 μg/ml (solid lines).
FIGURE 3
FIGURE 3
Distributions Ψ of the run-length Δxb for different motor concentrations c. Histograms show the experimental data, and the solid lines the least-square fit of the theoretical distribution as given by Eq. 5 for concentrations up to 2.5 μg/ml.
FIGURE 4
FIGURE 4
Excess kinesin concentration in the solution as a function of total kinesin concentration in the incubation protocol: One set of data (squares) corresponds to SDS-PAGE of the untreated kinesin-bead solution; the other set of data (diamonds) has been obtained after centrifugation plus filtering of the kinesin-bead solution and subsequent SDS-PAGE of the filtered solution. The straight reference line corresponds to excess kinesin being equal to total kinesin.

References

    1. Howard, J. 2001. Mechanics of Motor Proteins and the Cytoskeleton. Sinauer Associates, Sunderland, MA.
    1. Schliwa, M. (Editor.). 2003. Molecular Motors. Wiley-VCH, Weinheim, Germany.
    1. Howard, J., A. J. Hudspeth, and R. D. Vale. 1989. Movement of microtubules by single kinesin molecules. Nature. 342:154–158. - PubMed
    1. Block, S. M., L. S. B. Goldstein, and B. J. Schnapp. 1990. Bead movement by single kinesin molecules studied with optical tweezers. Nature. 348:348–352. - PubMed
    1. Visscher, K., M. J. Schnitzer, and S. M. Block. 1999. Single kinesin molecules studied with a molecular force clamp. Nature. 400:184–189. - PubMed

Publication types

LinkOut - more resources