Comparative Study
. 2007 Sep;4(3):294-308.
doi: 10.1088/1741-2560/4/3/015. Epub 2007 Jul 6.

Region-specific network plasticity in simulated and living cortical networks: comparison of the center of activity trajectory (CAT) with other statistics

Affiliations
Comparative Study

Region-specific network plasticity in simulated and living cortical networks: comparison of the center of activity trajectory (CAT) with other statistics

Zenas C Chao et al. J Neural Eng. 2007 Sep.

Abstract

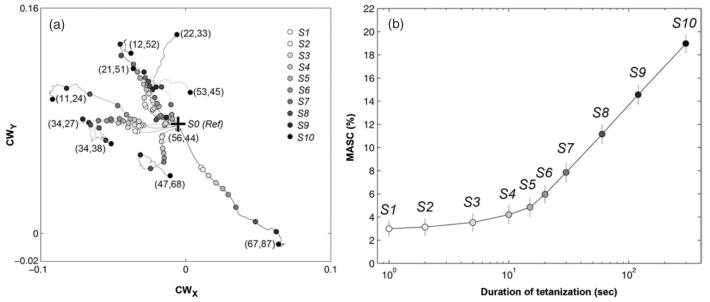
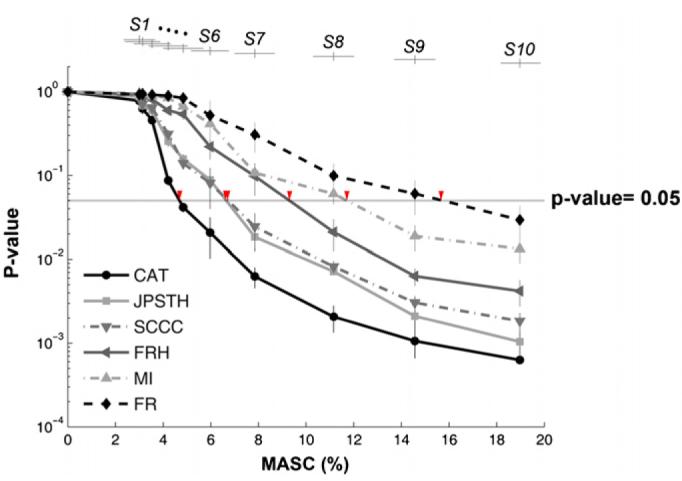
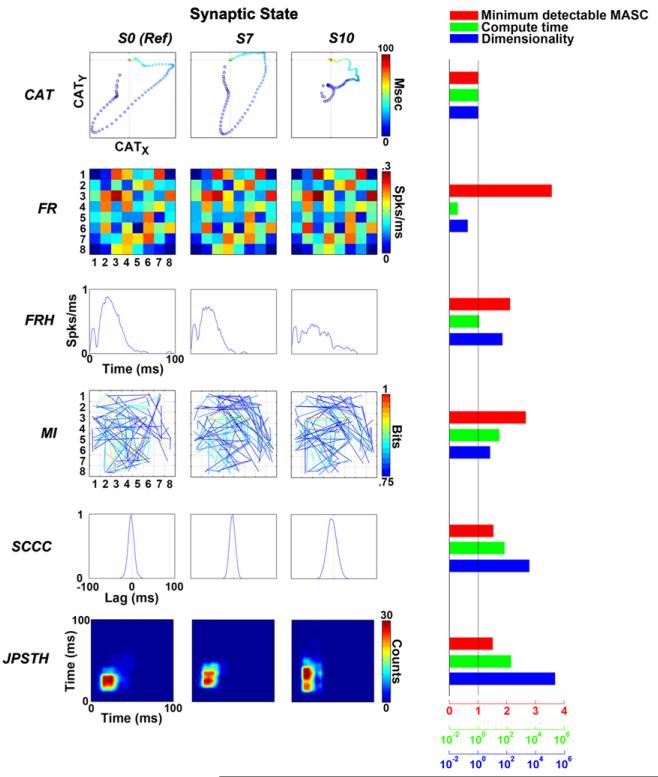
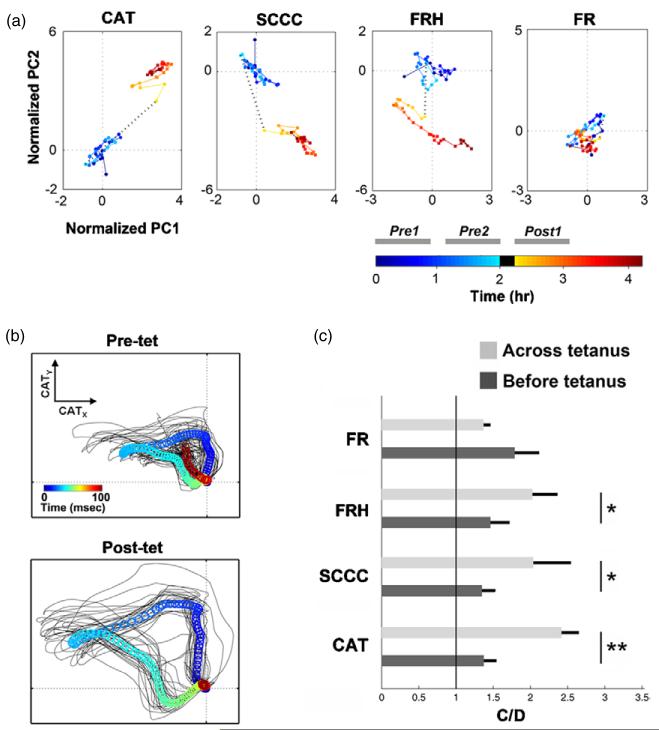
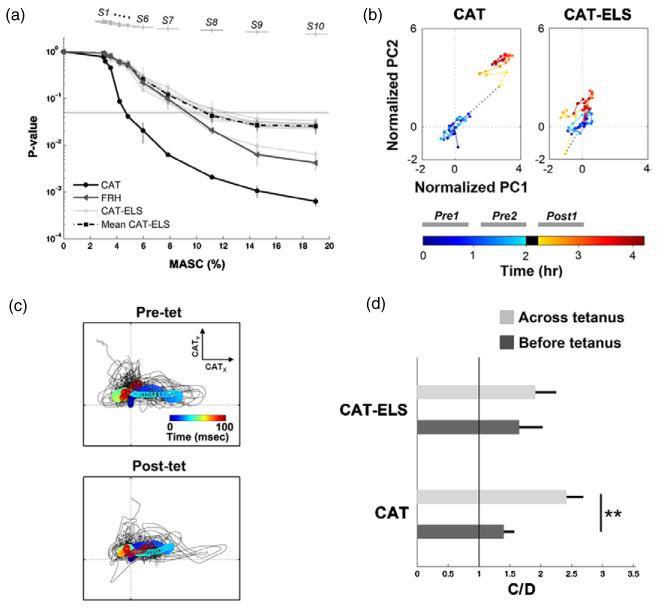
Electrically interfaced cortical networks cultured in vitro can be used as a model for studying the network mechanisms of learning and memory. Lasting changes in functional connectivity have been difficult to detect with extracellular multi-electrode arrays using standard firing rate statistics. We used both simulated and living networks to compare the ability of various statistics to quantify functional plasticity at the network level. Using a simulated integrate-and-fire neural network, we compared five established statistical methods to one of our own design, called center of activity trajectory (CAT). CAT, which depicts dynamics of the location-weighted average of spatiotemporal patterns of action potentials across the physical space of the neuronal circuitry, was the most sensitive statistic for detecting tetanus-induced plasticity in both simulated and living networks. By reducing the dimensionality of multi-unit data while still including spatial information, CAT allows efficient real-time computation of spatiotemporal activity patterns. Thus, CAT will be useful for studies in vivo or in vitro in which the locations of recording sites on multi-electrode probes are important.


Figures

Figure 1
Figure 1
Living MEA culture versus simulated network. The simulated neural network and stimulation electrodes were constructed to mimic the dissociated cultured network and MEA setup. (a) A view of a living MEA culture with 60 electrodes. (b) Neurons, tagged with yellow fluorescent protein, in the highlighted area shown in (a). (c) The structure of a simulated network with 1000 LIF neurons located in a 3 mm by 3 mm region. The circles indicate the neurons, the light-gray lines represent the excitatory synapses and the dark-gray lines represent the inhibitory synapses. All neurons are shown but only 15% of the synaptic connections are shown for clarity. The thick black lines emphasize the connections from a particular randomly selected neuron. (d) The locations of 64 electrodes are shown in circles, and marked with column–row numbers. The connections of the same neuron highlighted in (c) are depicted in light gray.
Figure 2
Figure 2
Whole-input–output (WIO) vectors for analyzing performances of different statistics. WIO vectors calculated from each statistic were used to represent the network input–output function. As an example, the WIO vector of CAT calculated from probe responses to one RPS at one network state is demonstrated. (a) An RPS, RPSk, was delivered into a network with the synaptic state Si. (b) CA was calculated for evoked responses to the stimulation electrode Pj (j = 1 to 60). Each frame indicates the firing rate over a 5 ms moving time window (with a 500 μs time step) on an 8 by 8 grid of electrodes averaged over multiple stimuli at Pj (RPSk might have multiple stimuli delivered at Pj , see (a)). The 2D trajectory of CAs from frame 1 to frame N (from 0 to 100 ms after the stimuli), CAT, can be represented by a 1D vector by joining CATX and CATY. This vector represents CAT of responses to stimuli Pj at the network state Si. (c) CATs for responses to 60 different stimulation electrodes (P1 to P60) were joined together to form the WIO vector. This WIO vector represents the input–output function, in terms of CAT, of the network state Si. For each statistic, each synaptic state has one corresponding WIO vector to describe its input–output function. The statistic that is sensitive to changes in network synaptic states should be able to show significantly different WIO vectors from different synaptic states. One WIO vector was constructed for each RPS (RPSk, k = 1 to10) in each network state (Si, i = 0 to10). Therefore, for each statistic, 5050 WIO vectors were obtained (=(500 + 5) × 10. 505: 500 new networks + 5 reference networks, 10: number of RPSs delivered to each network).
Figure 3
Figure 3
Multi-dimensional whole-input–output (WIO) vectors measured in different synaptic states in simulated networks. The WIO vectors measured from different synaptic states were different. This is a cross-viewing 3D stereogram of an example of the WIO vectors for CATs from the simulations at S0 to S10 (generated by the same tetanization electrodes). Principal components analysis (PCA) was applied on the WIO vectors to visualize the data. Each symbol represents the first three principal components (PC1–PC3) of the WIO vector of a CAT from one simulation. Each synaptic state Si has ten corresponding symbols, which represent the results from ten different simulations (with different RPSs). The distance of each symbol from the centroid of S0 (shown as a cross) indicates the amount of change in CATs between the corresponding synaptic state and the reference state. CATs obtained from the synaptic states generated by longer tetanizations were further from CATs obtained from S0 than those from shorter tetanizations, indicating that longer tetani cause greater plasticity.
Figure 4
Figure 4
Comparison of the network activities from a MEA culture and a simulated network. Simulated spontaneous activity and evoked responses resemble the experimentally recorded data. First row: 1 min of spontaneous activity was recorded from a living network by a 60 channel MEA and in simulation for comparison. The upper panels are spike raster plots. The lower panels are firing rate histograms, with bin sizes of 100 ms. Second row: 50 trials of evoked responses recorded by one electrode in a living network and in simulation are shown for comparison. The upper panels are spike raster plots. The lower panels are firing rate histograms with a bin size of 0.1 ms. The timings of stimuli for each trial were aligned at time zero. In the simulation, each electrode recorded the activities occurring within 100 μm.
Figure 5
Figure 5
Setup of different synaptic states in simulation. A series of networks with different synaptic states were obtained by tetanization at different electrode pairs and with different durations from the reference network. From each reference network S0, ten tetani at different electrode pairs were delivered. For each tetanization electrode pair, ten synaptic states were obtained after different durations. (a) Different tetanization electrode pairs caused different changes in synaptic weight distribution. The center of weights (CW) (see supplemental materials 7 available at stacks.iop.org/JNE/4/294) was used to visualize how the symmetry of the network synaptic weight distribution changed over time. Each curve represents CWs corresponding to a tetanization electrode pair (the column–row numbers of the electrodes are shown at the end of each curve). Synaptic states (S1 to S10) ‘collected’ at different tetanization durations and the corresponding reference state S0 are shown as dots. (b) The relation between mean absolute synaptic change (MASC) and the duration of tetanization (note log scale) from five reference networks. The means and the standard deviations of MASCs are shown (n = 50 networks: from five reference networks, each with ten different tetani).
Figure 6
Figure 6
Evaluating the performances of different statistics. CAT showed the highest performance to detect changes in the synaptic state among six statistics. The performance of different statistics to detect changes in the synaptic state was evaluated by finding the ‘detectable MASC’ at the point the p-values reach a threshold of 0.05 (shown as arrows). For each state Si,50 p-values and 50 MASCs were collected from 50 networks (five reference networks with ten different tetanization electrode pairs per reference network, see results). The mean and standard deviation of the p-values (n = 50 networks) were plotted versus the corresponding MASC averaged across the networks (n 50 networks). The mean and standard deviation of MASCs (n = 50 networks) are shown on the top of the figure (with vertical offsets for clarity). The performance of the statistic to detect the difference in MASC shown in descending order is CAT, JPSTH, SCCC, FRH, MI and FR.
Figure 7
Figure 7
Comparison of the six different statistics. CAT was the most sensitive activity statistic and was highly efficient. Examples of six statistics calculated from the same RPS during three synaptic states are shown: S0 (reference network), S7 (network with ∼50% of the maximal MASC, see figure 5(b)) and S10 (network with the maximal MASC). All statistics were obtained from the same randomly chosen stimulation electrode. CAT: CATs are plotted as CATX versus CATY from blue to red. FR: number of spikes per ms at each recording electrode is displayed according to the corresponding location in the 8 by 8 grids. FRH: FRHs, in the unit of number of spikes per ms, from a randomly chosen recording electrode are plotted. MI: MIs above 0.75 bits are plotted as colored lines between the corresponding electrode pairs. SCCC: SCCCs above zero from a randomly chosen pair of recording electrodes are plotted. JPSTH: JPSTH from the same randomly chosen pair of recording electrodes are shown. The performance (quantified by detectable MASC), compute time and dimensionality, normalized by the values for CAT, are shown on the right. The axes for detectable MASC, compute time and dimensionality are shown on the bottom in red, green and blue respectively (the latter two are with logarithmic scales). Among all six statistics, only FR and FRH had shorter compute time than CAT, and only FR had smaller dimensionality than CAT. However, CAT had significantly smaller detectable MASC than FR and FRH. CAT showed significantly higher performance to detect the difference in the network synaptic state than other statistics.
Figure 8
Figure 8
Comparison of the changes in CAT, FR, FRH and SCCC across tetanization in living MEA cultures. (a) An example of comparison of CAT, FR, FRH and SCCC (from evoked responses to RPS in one experiment) before and after tetanization is shown. Principal components analysis (PCA) was applied on multi-dimensional WIO vectors for visualization purposes. The normalized principal component was obtained by removing its mean and then dividing through by its standard deviation. The normalized first principal component (PC1) was plotted versus the normalized second principal component (PC2). Each dot represents the statistic calculated from every block (a 240 s window), and the color indicates the corresponding time (shown in the colorbar). The black dashed line represents the tetanus. The separation between pre-tetanization clusters (bluish dots) and post-tetanization clusters (reddish dots) indicates the change of the statistic across the tetanus. (b) Different patterns of CATs were observed before and after tetanization. CATs from an example experiment were overlaid (black trajectories), and the average CATs were shown by series of circles (from blue to red across 100 ms probe response). The trajectories for every experiment can be found in the supplemental materials 6 (available at stacks.iop.org/JNE/4/294). (c) The statistics of C/D from six experiments showed that the change across the tetanus was significantly greater than the drift before the tetanus for CAT (**, p < 1 × 10⁻⁴, Wilcoxon signed rank test), FRH (*, p < 0.01) and SCCC (*, p < 0.01), but not for FR (p = 0.013). The p-values indicate that CAT was more capable of detecting the change over the drift than FRH, SCCC and FR.
Figure 9
Figure 9
Comparison of CAT and CAT-ELS in simulated and living networks. (a) A comparison of the performance of CAT and CAT-ELS in simulated networks (the representation is the same as figure 6). Ten performance curves corresponding to different random shuffled electrode locations (CAT-ELS) and the mean of the ten curves (Mean CAT-ELS) are shown. The performance curve of FRH is also shown for comparison. The detectable MASC (threshold p-value = 0.05) for mean CAT-ELS was 10.8%, which was greater than CAT (4.68%). The decrease in performance (increase in detectable MASC) indicates the importance of physical electrode locations in the performance of CAT in simulated networks. (b) An example comparison of CAT and CAT-ELS in a living MEA culture before and after tetanization (the data used and representation are the same as in figure 8(a)). The difference between pre-tetanization clusters (bluish dots) and post-tetanization clusters (reddish dots) was reduced by shuffling electrode locations in CAT-ELS. (c) The electrode locations shuffling ‘collapsed’ the patterns of CAT-ELSs before and after tetanization in a living MEA culture. The difference between before and after tetanization trajectories (compared to figure 8(b)) was reduced in CAT-ELS. (d) The statistics of C/D for CAT-ELS in living networks (n = 60, six experiments, ten shuffles for each experiment). The change across the tetanus was not significantly different than the drift before the tetanus (p = 0.19, Wilcoxon signed rank test), unlike CAT (**, p < 1 × 10⁻⁴). Thus, for both simulated and living networks, the shuffling of signals from different electrodes greatly reduces the performance of CAT for detecting stimulus-induced synaptic change over a background of continual synaptic drift.

Similar articles

Cited by

References

    1. Ahissar E, Abeles M, Ahissar M, Haidarliu S, Vaadia E. Hebbian-like functional plasticity in the auditory cortex of the behaving monkey. Neuropharmacology. 1998;37:633–55. - PubMed
    1. Ahissar E, Vaadia E, Ahissar M, Bergman H, Arieli A, Abeles M. Dependence of cortical plasticity on correlated activity of single neurons and on behavioral context. Science. 1992;257:1412–5. - PubMed
    1. Bao S, Chang EF, Davis JD, Gobeske KT, Merzenich MM. Progressive degradation and subsequent refinement of acoustic representations in the adult auditory cortex. J. Neurosci. 2003;23:10765–75. - PMC - PubMed
    1. Baruchi I, Ben-Jacob E. Functional holography of recorded neuronal networks activity. J. Neuroinform. 2004;2:333–52. - PubMed
    1. Bi GQ, Poo MM. Synaptic modifications in cultured hippocampal neurons: dependence on spike timing, synaptic strength, and postsynaptic cell type. J. Neurosci. 1998;18:10464–72. - PMC - PubMed

Publication types