Comparative Study
. 2007 Oct;39(10):1217-24.
doi: 10.1038/ng2142. Epub 2007 Sep 16.

Population genomics of human gene expression

Affiliations
Comparative Study

Population genomics of human gene expression

Barbara E Stranger et al. Nat Genet. 2007 Oct.

Abstract

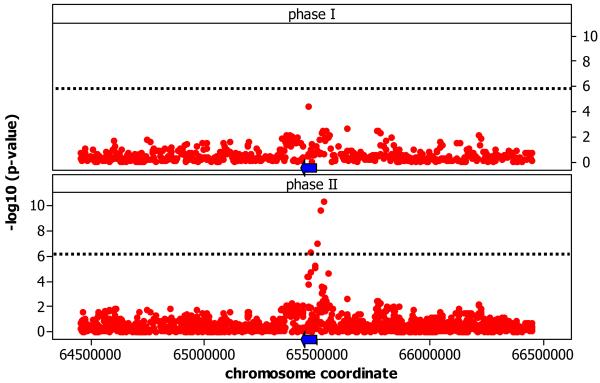
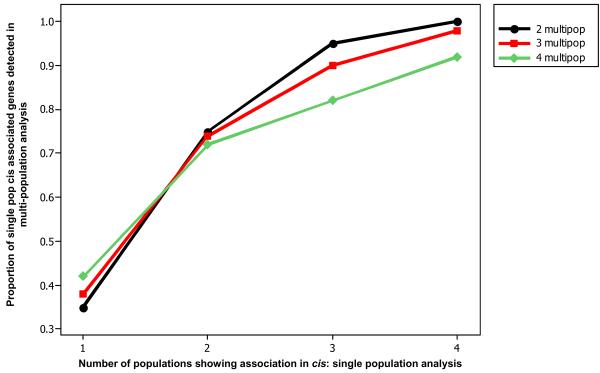
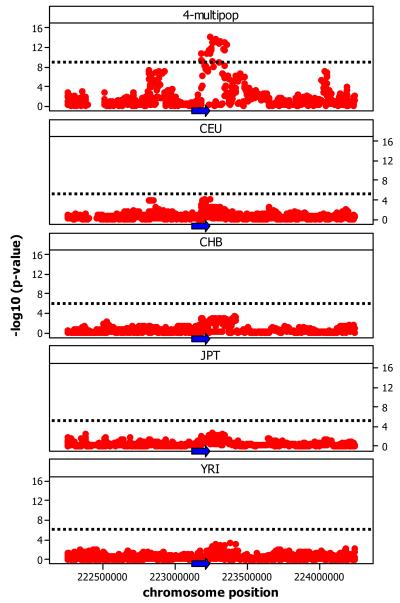
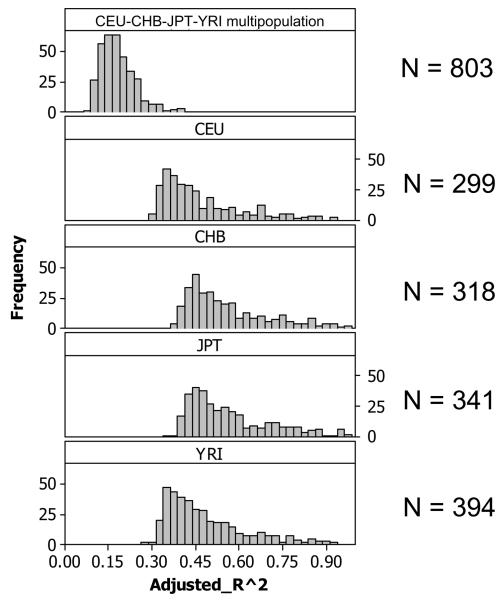
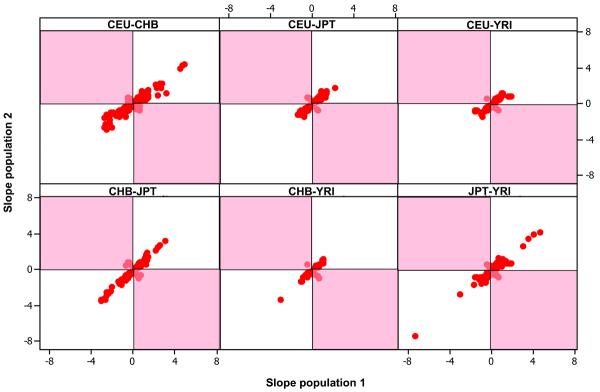
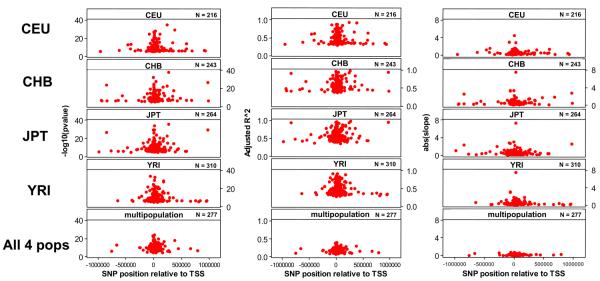
Genetic variation influences gene expression, and this variation in gene expression can be efficiently mapped to specific genomic regions and variants. Here we have used gene expression profiling of Epstein-Barr virus-transformed lymphoblastoid cell lines of all 270 individuals genotyped in the HapMap Consortium to elucidate the detailed features of genetic variation underlying gene expression variation. We find that gene expression is heritable and that differentiation between populations is in agreement with earlier small-scale studies. A detailed association analysis of over 2.2 million common SNPs per population (5% frequency in HapMap) with gene expression identified at least 1,348 genes with association signals in cis and at least 180 in trans. Replication in at least one independent population was achieved for 37% of cis signals and 15% of trans signals, respectively. Our results strongly support an abundance of cis-regulatory variation in the human genome. Detection of trans effects is limited but suggests that regulatory variation may be the key primary effect contributing to phenotypic variation in humans. We also explore several methodologies that improve the current state of analysis of gene expression variation.


Figures

Figure 1
Figure 1
Associations of SNPs with gene expression of SPRED2 on chromosome 2. Panels contrast the results obtained using phase I HapMap SNPs and phase II HapMap SNPs. Coordinates are in NCBI Build 35. Blue arrows represent the location (not to scale) and direction of transcription of the associated gene.
Figure 2
Figure 2
Comparison of detected cis associations between single and multi-population analysis. (A) Numbers of genes with significant cis- associations as uncovered by single and multi-population analysis and proportion overlap of associations across the two methodologies. (B) Associations of SNPs of the phase II HapMap with gene expression of SGPP2 on chromosome 2. Coordinates are in NCBI Build 35. Panels show results of 4-population multi-population analysis, and individual population analysis for CEU, CHB, JPT, and YRI. Blue arrows represent the location (not to scale) and direction of transcription of the associated gene. In this case the SNP was not rare in any of the populations (MAF was between 0.08 and 0.44) but the effect was small (R2 = 0.25 and slope = 0.25) so it could only be detected when we pooled the populations increasing the sample size. (C) Comparison of the adjusted R2 values (proportion of the variance in expression explained by the linear relationship between genotype and phenotype) of cis significant associations obtained from single and multi-population analysis (0.001 permutation threshold).
Figure 2
Figure 2
Comparison of detected cis associations between single and multi-population analysis. (A) Numbers of genes with significant cis- associations as uncovered by single and multi-population analysis and proportion overlap of associations across the two methodologies. (B) Associations of SNPs of the phase II HapMap with gene expression of SGPP2 on chromosome 2. Coordinates are in NCBI Build 35. Panels show results of 4-population multi-population analysis, and individual population analysis for CEU, CHB, JPT, and YRI. Blue arrows represent the location (not to scale) and direction of transcription of the associated gene. In this case the SNP was not rare in any of the populations (MAF was between 0.08 and 0.44) but the effect was small (R2 = 0.25 and slope = 0.25) so it could only be detected when we pooled the populations increasing the sample size. (C) Comparison of the adjusted R2 values (proportion of the variance in expression explained by the linear relationship between genotype and phenotype) of cis significant associations obtained from single and multi-population analysis (0.001 permutation threshold).
Figure 3
Figure 3
Comparison of the direction of shared SNP-gene allelic effects across all pairs of populations (0.001 permutation threshold). White panels indicate effects in the same direction.
Figure 4
Figure 4
Statistical significance, adjusted R2 of the association (proportion of the expression variance explained by the linear relationship between genotype and phenotype), and absolute value of the slope of the linear regression, as a function of distance from the transcription start site, of the most significantly associated SNP per gene in each of the 4 populations (order CEU, CHB, JPT and YRI) and the pooled sample of all 4 populations.

Comment in

  • Pinpointing expression differences.
    [No authors listed] [No authors listed] Nat Genet. 2007 Oct;39(10):1175. doi: 10.1038/ng1007-1175. Nat Genet. 2007. PMID: 17898770 No abstract available.

References

    1. Ferrari SL, et al. Polymorphisms in the low-density lipoprotein receptor-related protein 5 (LRP5) gene are associated with variation in vertebral bone mass, vertebral bone size, and stature in whites. Am J Hum Genet. 2004;74:866–75. - PMC - PubMed
    1. Bansal A, et al. Association testing by DNA pooling: an effective initial screen. Proc Natl Acad Sci U S A. 2002;99:16871–4. - PMC - PubMed
    1. Mahley RW, Huang Y. Apolipoprotein E: from atherosclerosis to Alzheimer's disease and beyond. Curr Opin Lipidol. 1999;10:207–17. - PubMed
    1. Kleinjan DA, van Heyningen V. Long-range control of gene expression: emerging mechanisms and disruption in disease. Am J Hum Genet. 2005;76:8–32. - PMC - PubMed
    1. Valentonyte R, et al. Sarcoidosis is associated with a truncating splice site mutation in BTNL2. Nat Genet. 2005;37:357–64. - PubMed

Publication types

Associated data