

Characterization of radiologists' search strategies for lung nodule detection: slice-based versus volumetric displays
- PMID: 17874330
- PMCID: PMC3043872
- DOI: 10.1007/s10278-007-9076-x
Characterization of radiologists' search strategies for lung nodule detection: slice-based versus volumetric displays
Abstract
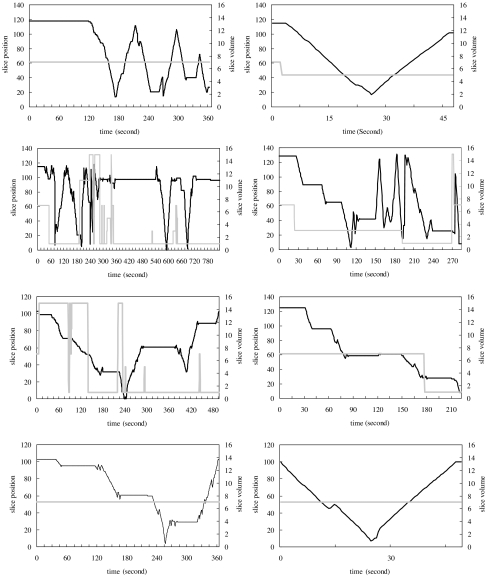
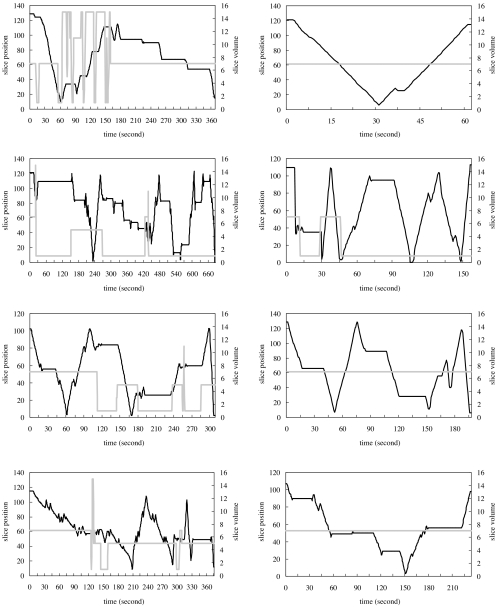
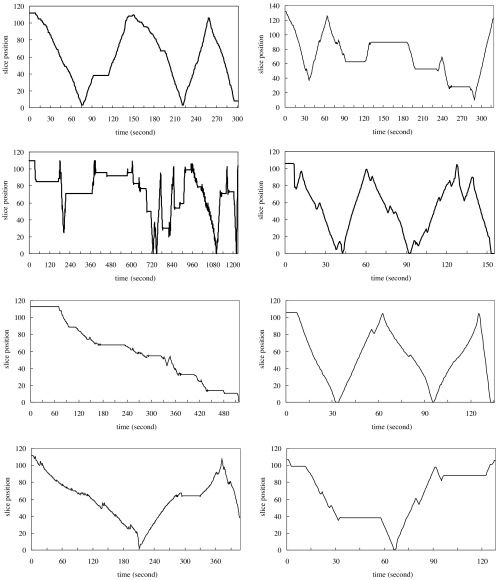
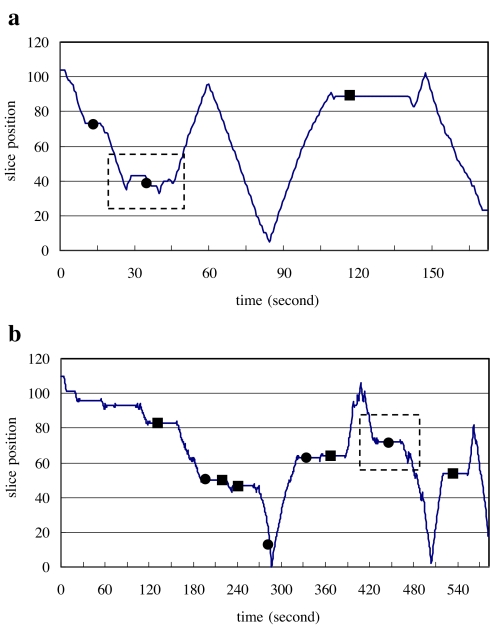
The goal of this study was to assess whether radiologists' search paths for lung nodule detection in chest computed tomography (CT) between different rendering and display schemes have reliable properties that can be exploited as an indicator of ergonomic efficiency for the purpose of comparing different display paradigms. Eight radiologists retrospectively viewed 30 lung cancer screening CT exams, containing a total of 91 nodules, in each of three display modes [i.e., slice-by-slice, orthogonal maximum intensity projection (MIP) and stereoscopic] for the purpose of detecting and classifying lung nodules. Radiologists' search patterns in the axial direction were recorded and analyzed along with the location, size, and shape for each detected feature, and the likelihood that the feature is an actual nodule. Nodule detection performance was analyzed by employing free-response receiver operating characteristic methods. Search paths were clearly different between slice-by-slice displays and volumetric displays but, aside from training and novelty effects, not between MIP and stereographic displays. Novelty and training effects were associated with the stereographic display mode, as evidenced by differences between the beginning and end of the study. The stereo display provided higher detection and classification performance with less interpretation time compared to other display modes tested in the study; however, the differences were not statistically significant. Our preliminary results indicate a potential role for the use of radiologists' search paths in evaluating the relative ergonomic efficiencies of different display paradigms, but systematic training and practice is necessary to eliminate training curve and novelty effects before search strategies can be meaningfully compared.
Figures

Similar articles
-
Compare display schemes for lung nodule CT screening.J Digit Imaging. 2011 Jun;24(3):478-84. doi: 10.1007/s10278-010-9293-6. J Digit Imaging. 2011. PMID: 20386949 Free PMC article.
-
Stereo CT image compositing methods for lung nodule detection and characterization.Acad Radiol. 2005 Dec;12(12):1512-20. doi: 10.1016/j.acra.2005.06.009. Acad Radiol. 2005. PMID: 16321739 Clinical Trial.
-
Pulmonary nodule volumetric measurement variability as a function of CT slice thickness and nodule morphology.AJR Am J Roentgenol. 2007 Feb;188(2):306-12. doi: 10.2214/AJR.05.1063. AJR Am J Roentgenol. 2007. PMID: 17242235
-
Noncalcified lung nodules: volumetric assessment with thoracic CT.Radiology. 2009 Apr;251(1):26-37. doi: 10.1148/radiol.2511071897. Radiology. 2009. PMID: 19332844 Free PMC article. Review.
-
Lung nodule detection and characterization with multi-slice CT.J Thorac Imaging. 2005 Aug;20(3):196-209. doi: 10.1097/01.rti.0000171625.92574.8d. J Thorac Imaging. 2005. PMID: 16077335 Review.
Cited by
-
Evaluation of Virtual Reality for Detection of Lung Nodules on Computed Tomography.Tomography. 2018 Dec;4(4):204-208. doi: 10.18383/j.tom.2018.00053. Tomography. 2018. PMID: 30588506 Free PMC article.
-
Evaluating interaction techniques for stack mode viewing.J Digit Imaging. 2009 Aug;22(4):369-82. doi: 10.1007/s10278-008-9140-1. Epub 2008 Jul 23. J Digit Imaging. 2009. PMID: 18649069 Free PMC article.
-
Compare display schemes for lung nodule CT screening.J Digit Imaging. 2011 Jun;24(3):478-84. doi: 10.1007/s10278-010-9293-6. J Digit Imaging. 2011. PMID: 20386949 Free PMC article.
-
Recent technological and application developments in computed tomography and magnetic resonance imaging for improved pulmonary nodule detection and lung cancer staging.J Magn Reson Imaging. 2010 Dec;32(6):1353-69. doi: 10.1002/jmri.22383. J Magn Reson Imaging. 2010. PMID: 21105140 Free PMC article. Review.
-
Lung nodule and cancer detection in computed tomography screening.J Thorac Imaging. 2015 Mar;30(2):130-8. doi: 10.1097/RTI.0000000000000140. J Thorac Imaging. 2015. PMID: 25658477 Free PMC article. Review.
References
Publication types
MeSH terms
Grants and funding
LinkOut - more resources
Full Text Sources
Medical
