. 2007 Oct 1;204(10):2267-75.
doi: 10.1084/jem.20070525. Epub 2007 Sep 17.

The transcription factor XBP-1 is essential for the development and survival of dendritic cells

Affiliations

The transcription factor XBP-1 is essential for the development and survival of dendritic cells

Neal N Iwakoshi et al. J Exp Med. .

Abstract

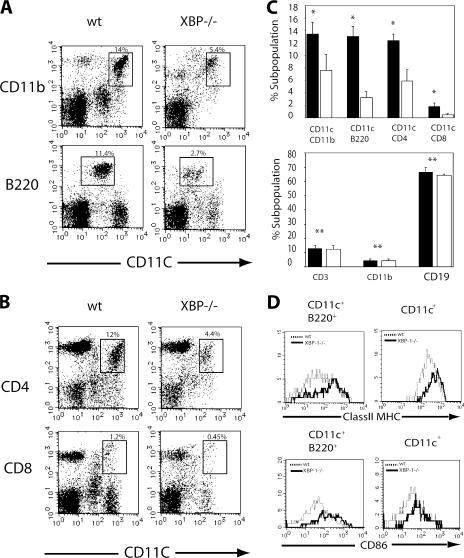
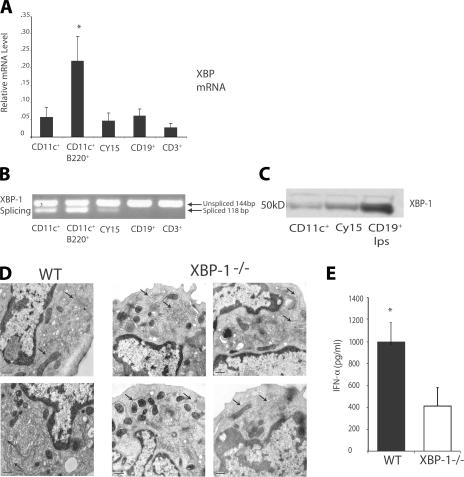
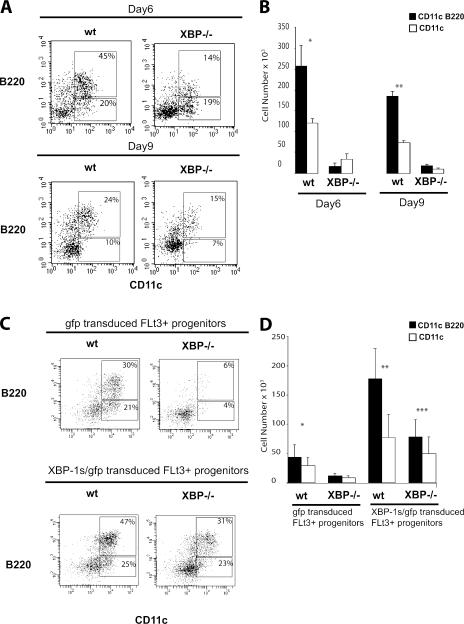
Dendritic cells (DCs) play a critical role in the initiation, maintenance, and resolution of an immune response. DC survival is tightly controlled by extracellular stimuli such as cytokines and Toll-like receptor (TLR) signaling, but the intracellular events that translate such extracellular stimuli into life or death for the DC remain poorly understood. The endoplasmic reticulum (ER) stress, or unfolded protein response (UPR), is a signaling pathway that is activated when unfolded proteins accumulate in the ER. The most conserved arm of the UPR involves IRE1alpha, an ER transmembrane kinase and endoribonuclease that activates the transcription factor XBP-1 to maintain ER homeostasis and prevent activation of cell death pathways caused by sustained ER stress. We report that XBP-1 is essential for DC development and survival. Lymphoid chimeras lacking XBP-1 possessed decreased numbers of both conventional and plasmacytoid DCs with reduced survival both at baseline and in response to TLR signaling. Overexpression of XBP-1 in hematopoietic progenitors rescued and enhanced DC development. Remarkably, in contrast to other cell types we have examined, the XBP-1 pathway was constitutively activated in immature DCs.


Figures

Figure 1.
Figure 1.
XBP-1–deficient lymphoid chimeras have reduced numbers of conventional and pDCs. (A) Low density mouse spleen cells from WT or XBP-1−/− animals were isolated and depleted of CD19+ and DX5+ cells by immunomagnetic bead negative selection. DCs were analyzed by flow cytometry for CD11b or B220 staining on CD11c+ cells (CD19DX5). (B) CD4 and CD8α staining of CD11c+ (CD19DX5)-enriched low density mouse spleen cells from WT or XBP-1−/− animals. (C) Percentage of splenic DC (top) and lymphocyte (bottom subsets from WT (shaded bar) or XBP-1−/− (open bar) animals. The data represent the mean + SEM (n = 3). Values in A represent the percentage of each DC subset from low density mouse spleen cells isolated and depleted of CD19+ and DX5+ cells by immunomagnetic bead negative selection. Values for lymphocyte subsets in B represent percentages from unenriched low density spleen preparations. *, P < 0.02 when comparing WT with XBP-1 samples; **, NS. (D) Activated phenotype of XBP-1−/− splenic DCs. Enriched low density populations from WT and XBP-1−/− animals were gated for CD11c+ and CD11c+B220+ subsets and analyzed for CD86 and MHC class II expression. Numbers indicate the percentage of cells in each CD11c+ subset. The experiment shown is representative of three independent experiments performed.
Figure 2.
Figure 2.
Constitutive expression and splicing of XBP-1 in DCs. (A) Enriched low density spleens cell were sorted for CD3+, CD19+, CD11c+, and CD11c+B220+ (DX5) cell subsets. Purified subsets and the transformed DC line CY15 were analyzed by RT-PCR using XBP-1 and β-actin–specific probes. *, P < 0.05 when comparing with all other groups. The data represent mean values ± SD from three independent experiments. (B) Total RNA from purified subsets (shown in A) and CY15 cells was isolated for RT-PCR analysis. Primers spanning the splice junction in mice Xbp-1 were used to amplify products of unspliced and spliced mRNA. PCR products were separated by electrophoresis on a 3% agarose gel and visualized by ethidium bromide staining. (C) Immunoblot analysis of XBP-1s protein in CD11c+ and CY15 cells and splenic B cells stimulated with LPS. Results are representative of three separate experiments. (D) Electron micrographs of FACS-sorted WT and XBP-1−/− CD11c+B220+ pDCs (arrows indicate ER cisternae). (E) IFN-α production of FACS-sorted WT and XBP-1−/− CD11c+B220+ pDCs in response to 1 μM CpG for 24 h. The data represent the mean + SEM (n = 3). *, P < 0.002 when comparing WT with XBP-1−/− samples. Bars, 50 nm.
Figure 3.
Figure 3.
Decreased development and survival of XBP-1−/− DCs. (A) c-Kit+lin–enriched BM cells were sorted and cultured for 6 d in msFlt3L- and SCF-supplemented media. Flow cytometric analysis of WT and XBP-1−/− BM cells stained for CD11c and B220. Numbers in gates represent percentages of gated cells. (B) Graph depicts numbers of WT and XBP-1−/− DCs derived from 105 BM cells cultured with msFlt3L and SCF at day 6. The data represent mean values ± SD from three independent experiments. * and **, P < 0.01 when comparing CD11c and CD11c/B220 WT with XBP-1−/− samples. (C) Flow cytometric analysis of GFP + cells derived from control-GFP– and XBP-1s–GFP–transduced Flt3+ progenitors cultured for 6 d in Flt3L- and SCF-supplemented media. Values represent percentages of total plotted cells. Results are representative of three independent experiments. (D) Graph depicts numbers of pDCs (shaded bars) and DCs (open bars) derived from 0.75 × 10⁵ GFP-transduced Flt3+ progenitors and XBP-1s–GFP–transduced Flt3+ progenitors cultured with Flt3L and SCF for 6 d. Bars represent mean values ± SD from three independent experiments. *, P < 0.04 when comparing WT gfp with XBP-1−/− gfp samples; **, P < 0.04 when comparing WT gfp with WT XBP-1s–gfp samples; ***, P < 0.02 when comparing XBP-1−/− XBP-1s–gfp with WT gfp and XBP-1−/− gfp samples.
Figure 4.
Figure 4.
DC lines with reduced XBP-1 activity are more sensitive to ER stress-induced apoptosis and exhibit decreased survival in vivo. (A) Increased apoptosis of XBP-1−/− DCs. WT and XBP-1−/− DCs. Apoptotic cell death was analyzed by flow cytometric staining with annexin V and 7-AAD. Numbers in gates represent percentages of gated cells. Data are representative of three to four independent experiments. (B) Failure to rescue apoptosis of XBP-1−/− DCs in response to TLR signaling. 3 × 10⁵ WT and XBP-1−/− pDCs were incubated with 1 μM CpG DNA or nCpG DNA, or 1 μg/ml LPS, for 24 h. Viable WT and XBP-1−/− cells were counted after Trypan blue dye exclusion at 24 h. Data are representative of three to four independent experiments. * and **, P < 0.01; and ***, P < 0.025 when comparing WT with XBP-1−/− samples. *, P < 0.01 when comparing WT versus ** and ***; *, NS when comparing XBP-1 versus ** and ***. (C) CY15 cells that express control GFP or dnXBP-1–GFP were treated with the indicated amount of tunicamycin for 24 h. Apoptotic cell death was analyzed by flow cytometric staining with annexin V and 7-AAD. (D) 106 control GFP or dnXBP-1–GFP CY15 cells were injected s.c. into RAG1−/− BALB/c mice. Mice were killed 30 d later, and the percentage of CY15-GFP cells in the respective organs was determined by flow cytometry. The data represent mean values ± SD from three independent experiments. *, P < 0.01; and **, P < 0.05 when comparing with XBP-1−/− samples.

References

    1. Reimold, A.M., N.N. Iwakoshi, J. Manis, P. Vallabhajosyula, E. Szomolanyi-Tsuda, E.M. Gravallese, D. Friend, M.J. Grusby, F. Alt, and L.H. Glimcher. 2001. Plasma cell differentiation requires transcription factor XBP-1. Nature. 412:300–307. - PubMed
    1. Lipson, K.L., S.G. Fonseca, S. Ishigaki, L.X. Nguyen, E. Foss, R. Bortell, A.A. Rossini, and F. Urano. 2006. Regulation of insulin biosynthesis in pancreatic beta cells by an endoplasmic reticulum-resident protein kinase IRE1. Cell Metab. 4:245–254. - PubMed
    1. Koumenis, C. 2006. ER stress, hypoxia tolerance and tumor progression. Curr. Mol. Med. 6:55–69. - PubMed
    1. Paschen, W., and T. Mengesdorf. 2005. Endoplasmic reticulum stress response and neurodegeneration. Cell Calcium. 38:409–415. - PubMed
    1. Liou, H.C., M.R. Boothby, P.W. Finn, R. Davidon, N. Nabavi, N.J. Zeleznik-Le, J.P. Ting, and L.H. Glimcher. 1990. A new member of the leucine zipper class of proteins that binds to the HLA DR alpha promoter. Science. 247:1581–1584. - PubMed

Publication types

MeSH terms

Substances